Capital One 1999 Annual Report Download - page 46
Download and view the complete annual report
Please find page 46 of the 1999 Capital One annual report below. You can navigate through the pages in the report by either clicking on the pages listed below, or by using the keyword search tool below to find specific information within the annual report.-
 1
1 -
2
-
3
-
4
-
5
-
6
-
7
-
8
-
9
-
10
-
11
-
12
-
13
-
14
-
15
-
16
-
17
-
18
-
19
-
20
-
21
-
22
-
23
-
24
-
25
-
26
-
27
-
28
-
29
-
30
-
31
-
32
-
33
-
34
-
35
-
 36
36 -
 37
37 -
 38
38 -
 39
39 -
 40
40 -
 41
41 -
 42
42 -
 43
43 -
 44
44 -
 45
45 -
 46
46 -
 47
47 -
 48
48 -
 49
49 -
 50
50 -
 51
51 -
 52
52 -
 53
53 -
 54
54 -
 55
55 -
 56
56 -
57
-
58
-
59
-
60
-
61
-
62
-
63
-
64
-
65
-
66
-
67
-
68
-
69
-
70
-
71
-
72
 |
 |

45
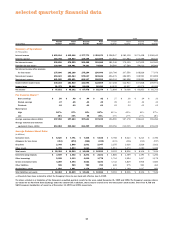
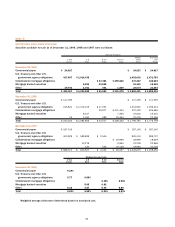
selected quarterly financial data
1999 1998
Fourth Third Second First Fourth Third Second First
(Unaudited) Quarter Quarter Quarter Quarter Quarter Quarter Quarter Quarter
Summary of Operations:
(In Thousands)
Interest income $ 450,604 $ 412,036 $ 377,773 $ 353,071 $ 298,947 $ 283,109 $ 271,438 $ 258,042
Interest expense 154,798 135,807 128,288 121,989 117,601 107,984 103,599 95,100
Net interest income 295,806 276,229 249,485 231,082 181,346 175,125 167,839 162,942
Provision for loan losses 120,000 114,061 74,301 74,586 54,580 67,569 59,013 85,866
Net interest income after provision
for loan losses 175,806 162,168 175,184 156,496 126,766 107,556 108,826 77,076
Non-interest income 654,623 621,063 572,047 524,626 456,476 386,955 328,953 315,899
Non-interest expense 681,185 629,421 606,137 548,253 466,034 381,598 329,951 287,003
Income before income taxes 149,244 153,810 141,094 132,869 117,208 112,913 107,828 105,972
Income taxes 51,372 58,448 53,616 50,490 44,539 42,907 40,975 40,269
Net income $ 97,872 $ 95,362 $ 87,478 $ 82,379 $ 72,669 $ 70,006 $ 66,853 $ 65,703
Per Common Share:(1)
Basic earnings $ .50 $ .48 $ .44 $ .42 $ .37 $ .36 $ .34 $ .33
Diluted earnings .47 .45 .41 .39 .35 .33 .32 .32
Dividends .03 .03 .03 .03 .03 .03 .03 .03
Market prices
High 5427⁄32 573⁄4601⁄65125⁄64 4113⁄16 435⁄16 414⁄5275⁄16
Low 357⁄8354⁄546 365⁄16 171⁄4272⁄3277⁄16 167⁄8
Average common shares (000s) 197,252 197,423 197,643 197,239 196,990 197,178 196,611 196,284
Average common and common
equivalent shares (000s) 210,284 210,142 211,499 209,991 209,056 210,035 208,582 205,245
Average Balance Sheet Data:
(In Millions)
Consumer loans $ 8,620 $ 7,791 $ 7,406 $ 6,832 $ 5,758 $ 5,623 $ 5,213 $ 4,786
Allowance for loan losses (312) (273) (254) (239) (231) (216) (213) (197)
Securities 2,348 1,898 1,831 2,047 2,155 1,626 1,826 1,922
Other assets 1,728 1,803 1,663 1,511 1,511 1,473 1,280 1,025
Total assets $ 12,384 $ 11,219 $ 10,646 $ 10,151 $ 9,193 $ 8,506 $ 8,106 $ 7,536
Interest-bearing deposits $ 3,649 $ 3,002 $ 2,271 $ 2,101 $ 1,886 $ 1,369 $ 1,193 $ 1,266
Other borrowings 2,038 1,333 1,600 1,778 1,704 1,594 1,417 1,175
Senior and deposit notes 4,259 4,494 4,621 4,190 3,742 3,819 3,906 3,683
Other liabilities 945 929 780 780 649 575 553 462
Stockholders’ equity 1,493 1,461 1,374 1,302 1,212 1,149 1,037 950
Total liabilities and equity $ 12,384 $ 11,219 $ 10,646 $ 10,151 $ 9,193 $ 8,506 $ 8,106 $ 7,536
(1) All periods have been restated to reflect the Company’s three-for-one stock split effective June 1, 1999.
The above schedule is a tabulation of the Company’s unaudited quarterly results for the years ended December 31, 1999 and 1998. The Company’s common shares
are traded on the New York Stock Exchange under the symbol COF. In addition, shares may be traded in the over-the-counter stock market. There were 9,738 and
9,692 common stockholders of record as of December 31, 1999 and 1998, respectively.