Capital One 1999 Annual Report Download - page 30
Download and view the complete annual report
Please find page 30 of the 1999 Capital One annual report below. You can navigate through the pages in the report by either clicking on the pages listed below, or by using the keyword search tool below to find specific information within the annual report.-
 1
1 -
2
-
3
-
4
-
5
-
6
-
7
-
8
-
9
-
10
-
11
-
12
-
13
-
14
-
15
-
16
-
17
-
18
-
19
-
 20
20 -
 21
21 -
 22
22 -
 23
23 -
 24
24 -
 25
25 -
 26
26 -
 27
27 -
 28
28 -
 29
29 -
 30
30 -
 31
31 -
 32
32 -
 33
33 -
 34
34 -
 35
35 -
 36
36 -
 37
37 -
 38
38 -
 39
39 -
 40
40 -
41
-
42
-
43
-
44
-
45
-
46
-
47
-
48
-
49
-
50
-
51
-
52
-
53
-
54
-
55
-
56
-
57
-
58
-
59
-
60
-
61
-
62
-
63
-
64
-
65
-
66
-
67
-
68
-
69
-
70
-
71
-
72
 |
 |

29
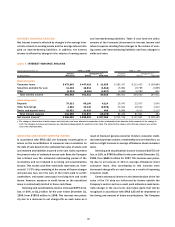
increased $311.1 million, or 83%, as average earning assets
increased 26% and the net interest margin increased to 9.51%
from 6.54%. The provision for loan losses increased $4.2 mil-
lion, or 2%, as the reported charge-off rate decreased to 4.24%
in 1998 from 4.83% in 1997, offset by average reported con-
sumer loans increasing 30%. Non-interest income increased
$419.2 million, or 39%, primarily due to the increase in aver-
age managed accounts of 39%. Increases in marketing
expenses of $221.4 million, or 98%, and salaries and benefits
expense of $187.1 million, or 65% reflect the increase in mar-
keting investment in existing and new product opportunities and
the cost of operations to manage the growth in the Company’s
accounts and products offered. Average managed consumer
loans grew 17% for the year ended December 31, 1998, to
$15.2 billion from $13.0 billion for the year ended December
31, 1997, and average accounts grew 39% for the same period
to 13.8 million from 9.9 million as a result of the continued suc-
cess of the Company’s marketing and account management
strategies.
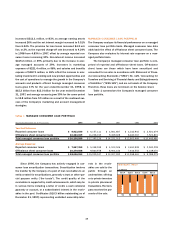
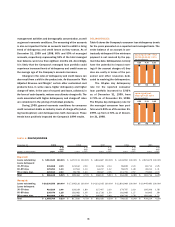
MANAGED CONSUMER LOAN PORTFOLIO
The Company analyzes its financial performance on a managed
consumer loan portfolio basis. Managed consumer loan data
adds back the effect of off-balance sheet consumer loans. The
Company also evaluates its interest rate exposure on a man-
aged portfolio basis.
The Company’s managed consumer loan portfolio is com-
prised of reported and off-balance sheet loans. Off-balance
sheet loans are those which have been securitized and
accounted for as sales in accordance with Statement of Finan-
cial Accounting Standards (“SFAS”) No. 125, “Accounting for
Transfers and Servicing of Financial Assets and Extinguishments
of Liabilities” (“SFAS 125”), and are not assets of the Company.
Therefore, those loans are not shown on the balance sheet.
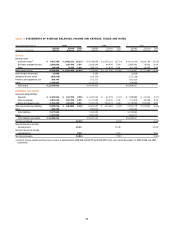
Table 1 summarizes the Company’s managed consumer
loan portfolio.
table 1: MANAGED CONSUMER LOAN PORTFOLIO
Year Ended December 31 (In Thousands) 1999 1998 1997 1996 1995
Year-End Balances:
Reported consumer loans $ 9,913,549 $ 6,157,111 $ 4,861,687 $ 4,343,902 $ 2,921,679
Off-balance sheet consumer loans 10,323,039 11,238,015 9,369,328 8,460,067 7,523,801
Total managed consumer loan portfolio $ 20,236,588 $ 17,395,126 $ 14,231,015 $ 12,803,969 $ 10,445,480
Average Balances:
Reported consumer loans $ 7,667,355 $ 5,348,559 $ 4,103,036 $ 3,651,908 $ 2,940,208
Off-balance sheet consumer loans 10,379,558 9,860,978 8,904,146 7,616,553 6,149,070
Total managed consumer loan portfolio $ 18,046,913 $ 15,209,537 $ 13,007,182 $ 11,268,461 $ 9,089,278
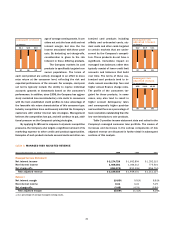
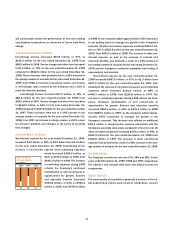
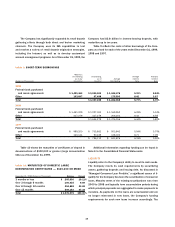
Since 1990, the Company has actively engaged in con-
sumer loan securitization transactions. Securitization involves
the transfer by the Company of a pool of loan receivables to an
entity created for securitizations, generally a trust or other spe-
cial purpose entity (“the trusts”). The credit quality of the
receivables is supported by credit enhancements, which may be
in various forms including a letter of credit, a cash collateral
guaranty or account, or a subordinated interest in the receiv-
ables in the pool. Certificates ($10.3 billion outstanding as of
December 31, 1999) representing undivided ownership inter-
ests in the receiv-
ables are sold to the
public through an
underwritten offering
or to private investors
in private placement
transactions. The Com-
pany receives the pro-
ceeds of the sale.
(in billions)
$10.4 $12.8 $14.2 $17.4 $20.2
95 96 97 98 99
managed loans