Capital One 1997 Annual Report Download - page 57
Download and view the complete annual report
Please find page 57 of the 1997 Capital One annual report below. You can navigate through the pages in the report by either clicking on the pages listed below, or by using the keyword search tool below to find specific information within the annual report.-
 1
1 -
2
-
3
-
4
-
5
-
6
-
7
-
8
-
9
-
10
-
11
-
12
-
13
-
14
-
15
-
16
-
17
-
18
-
19
-
20
-
21
-
22
-
23
-
24
-
25
-
26
-
27
-
28
-
29
-
30
-
31
-
32
-
33
-
34
-
35
-
36
-
37
-
38
-
39
-
40
-
41
-
42
-
43
-
44
-
45
-
46
-
 47
47 -
 48
48 -
 49
49 -
 50
50 -
 51
51 -
 52
52 -
 53
53 -
 54
54 -
 55
55 -
 56
56 -
 57
57 -
 58
58
 |
 |

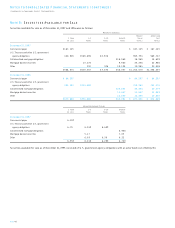
Note P: Capital One Financial
Corporation (Parent Company Only)
Condensed Financial Information
December 31
Balance Sheets 1997 1996
Assets:
Cash and cash equivalents $ 203 $ 16,073
Investment in subsidiaries 818,518 748,365
Loans to subsidiaries 207,507(1) 105,000
Other 5,001 2,333
Total assets $1,031,229 $871,771
Liabilities:
Senior notes $ 125,000 $125,000
Other 12,970 6,380
Total liabilities 137,970 131,380
Stockholders’ Equity: 893,259 740,391
Total liabilities and stockholders’ equity $1,031,229 $871,771
(1) As of December 31, 1997, includes $143,500 of cash invested at the Bank instead of
the open market.
Year Ended December 31
Statements of Income 1997 1996 1995
Interest from temporary
investments $ 11,352 $ 2,296 $ 560
Interest expense 11,067 3,013
Dividends, principally from
bank subsidiaries 228,000 117,400 11,000
Non-interest income 56
Non-interest expense 409 571 456
Income before income taxes
and equity in undistributed
earnings of subsidiaries 227,932 116,112 11,104
Income taxes (25) (490) 37
227,957 116,602 11,067
Equity in undistributed
earnings of subsidiaries (38,576) 38,665 115,444
Net income $189,381 $155,267 $126,511
Year Ended December 31
Statements of Cash Flows 1997 1996 1995
Operating Activities:
Net income $(189,381 $(155,267 $(126,511
Adjustments to reconcile net
income to net cash provided
by operating activities:
Equity in undistributed
earnings of subsidiaries 38,576 (38,665) (115,444)
Amortization of deferred
compensation 62 4,020
(Increase) decrease in
other assets (2,183) 2,017 (3,161)
Increase (decrease) in
other liabilities 6,590 6,380 (1,054)
Net cash provided by
operating activities 232,364 125,061 10,872
Investing Activities:
Increase in investment in
subsidiaries (83,366) (119,502) (2,470)
Increase in loans to
subsidiaries (102,507) (105,000)
Net cash used for investing
activities (185,873) (224,502) (2,470)
Financing Activities:
Proceeds from issuances of
common stock 4,957 3,109 1,257
Proceeds from exercise of
stock options 4,082 186 132
Issuance of senior notes 125,000
Purchases of treasury stock (50,762)
Dividends paid (20,638) (20,573) (15,883)
Net cash (used for) provided
by financing activities (62,361) 107,722 (14,494)
(Decrease) increase in cash
and cash equivalents (15,870) 8,281 (6,092)
Cash and cash equivalents
at beginning of year 16,073 7,792 13,884
Cash and cash equivalents
at end of year $(203 $(16,073 $(7,792
PAGE 55