Capital One 1997 Annual Report Download - page 23
Download and view the complete annual report
Please find page 23 of the 1997 Capital One annual report below. You can navigate through the pages in the report by either clicking on the pages listed below, or by using the keyword search tool below to find specific information within the annual report.-
 1
1 -
2
-
3
-
4
-
5
-
6
-
7
-
8
-
9
-
10
-
11
-
12
-
 13
13 -
 14
14 -
 15
15 -
 16
16 -
 17
17 -
 18
18 -
 19
19 -
 20
20 -
 21
21 -
 22
22 -
 23
23 -
 24
24 -
 25
25 -
 26
26 -
 27
27 -
 28
28 -
 29
29 -
 30
30 -
 31
31 -
 32
32 -
 33
33 -
34
-
35
-
36
-
37
-
38
-
39
-
40
-
41
-
42
-
43
-
44
-
45
-
46
-
47
-
48
-
49
-
50
-
51
-
52
-
53
-
54
-
55
-
56
-
57
-
58
 |
 |
PAGE 21
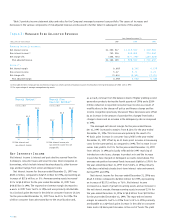
Risk Adjusted Revenue and Margin
In originating its consumer loan portfolio since the early 1990’s, the
Company has pursued a low introductory interest rate strategy with
accounts repricing to higher rates after six to sixteen months from
the date of origination (“first generation products”).The amount of
repricing is actively managed in an effort to maximize return at the
consumer level, reflecting the risk and expected performance of the
account.Separately, accounts also may be repriced upwards or down-
wards based on individual consumer performance. Many of the Com-
pany’s first generation products have a balance transfer feature under
which consumers can transfer balances from their other obligations
to the Company.The Company’s historic managed loan growth has
been principally the result of this balance transfer feature. Industry
competitors have continuously solicited the Company’s customers
with similar low introductory interest rate strategies. Management
believes that the competition has put, and will continue to put, addi-
tional pressure on low introductory interest rate strategies.
In applying its information-based strategies (“IBS”) and in
response to competitive pressures during late 1994, the Company
began to shift a significant amount of its marketing expense to second
generation product opportunities. Second generation products consist
of secured card products and other customized card products includ-
ing affinity and co-branded cards, college student cards and other
cards targeted to certain markets that were underserved by the Com-
pany’s competitors.These products do not have the immediate impact
on managed loan balances of the first generation products but typi-
cally consist of lower credit limit accounts and balances that build
over time.The terms of the second generation products tend to include
annual membership fees and higher annual finance charge rates.The
profile of the consumers targeted for the second generation products,
in some cases, may also tend to result in higher delinquency and con-
sequently higher past-due and overlimit fees as a percentage of loan
receivables outstanding than the first generation products.
Although these second generation products have differing charac-
teristics than first generation products, both meet the Company’s
objective of maximizing revenue for the level of risk undertaken.
Management believes that comparable measures for external analysis
are the risk adjusted revenue and risk adjusted margin of the portfo-
lio. Risk adjusted revenue is defined as net interest income and non-
interest income (exclusive of the impact resulting from the
implementation of SFAS 125) less net charge-offs. Risk adjusted
margin measures risk adjusted revenue as a percentage of average
managed earning assets. It considers not only the loan yield and net
interest margin, but also the fee income associated with these prod-
ucts. By deducting net charge-offs, consideration is given to the risk
inherent in these differing products.
In the fourth quarter of 1997, the Company modified its method-
ology for charging off credit card loans (net of any collateral) to
180 days past-due from the prior practice of charging off loans dur-
ing the next billing cycle after becoming 180 days past-due. As a
result, managed net interest income was reduced by $15.1 million
and managed non-interest income was reduced by $8.0 million for
the reversal of previously accrued finance charges and fee income. In
addition, this modification increased managed net charge-offs by
$47.4 million. Also, in the fourth quarter of 1997, the Company rec-
ognized the estimated uncollectible portion of finance charge and
fee income receivables which decreased loans by $50.2 million, man-
aged net interest income by $19.8 million and managed non-interest
income by $30.4 million. Risk adjusted revenue and risk adjusted
margin, without these modifications, would have been $1.3 billion
and 8.92%, respectively, in 1997.
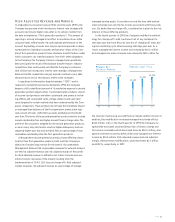
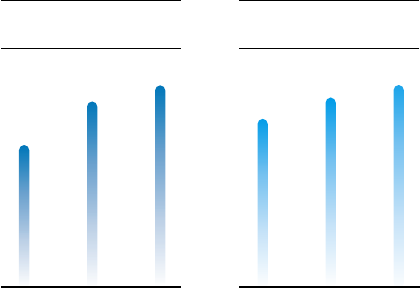
6.27%
Managed Net
Interest Margin
8.16%
8.86%
95 96 97
13.12%
Managed Loan Yield
14.76%
15.73%
95 96 97