Capital One 1997 Annual Report Download - page 3
Download and view the complete annual report
Please find page 3 of the 1997 Capital One annual report below. You can navigate through the pages in the report by either clicking on the pages listed below, or by using the keyword search tool below to find specific information within the annual report.-
 1
1 -
 2
2 -
 3
3 -
 4
4 -
 5
5 -
 6
6 -
 7
7 -
 8
8 -
 9
9 -
 10
10 -
 11
11 -
 12
12 -
 13
13 -
 14
14 -
15
-
16
-
17
-
18
-
19
-
20
-
21
-
22
-
23
-
24
-
25
-
26
-
27
-
28
-
29
-
30
-
31
-
32
-
33
-
34
-
35
-
36
-
37
-
38
-
39
-
40
-
41
-
42
-
43
-
44
-
45
-
46
-
47
-
48
-
49
-
50
-
51
-
52
-
53
-
54
-
55
-
56
-
57
-
58
 |
 |
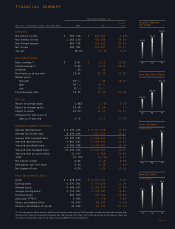
Year Ended December 31
Percent
(Dollars in thousands, except per share data) 1997 1996 Change
Earnings:
Net interest income $ 383,138 $ 365,484 4.83%
Non-interest income 1,069,130 763,424 40.04
Non-interest expense 883,978 713,182 23.95
Net income 189,381 155,267 21.97
Tax rate 38.0% 37.5% 1.33
Per Common Share:
Basic earnings (1) $ 2.87 $ 2.34 22.65
Diluted earnings(1) 2.80 2.32 20.69
Dividends .32 .32
Book value as of year-end 13.66 11.16 22.40
Market prices
Year-end 54 3/16 36 50.52
High 54 3/16 36 5/8
Low 31 3/821 7/8
Price /Earnings ratio 19.35 15.52 24.68
Ratios:
Return on average assets 2.88% 2.79% 3.23
Return on average equity 22.98 22.94 .17
Capital to assets 14.00 11.45 22.27
Allowance for loan losses to
loans as of year-end 3.76 2.73 37.73
Managed Consumer Loan Data:
Average reported loans $ 4,103,036 $ 3,651,908 12.35
Average securitized loans 8,904,146 7,616,553 16.91
Average total managed loans 13,007,182 11,268,461 15.43
Year-end reported loans 4,861,687 4,343,902 11.92
Year-end securitized loans 9,369,328 8,460,067 10.75
Year-end total managed loans 14,231,015 12,803,969 11.15
Year-end total accounts (000s) 11,747 8,586 36.82
Yield 15.73% 14.76% 6.57
Net interest margin 8.86 8.16 8.58
Delinquency rate (30+ days) 6.20 6.24 (.64)
Net charge-off rate 6.59 4.24 55.42
Year-End Reported Data:
Assets $ 7,078,279 $ 6,467,445 9.44
Earning assets 6,337,041 5,702,005 11.14
Average assets 6,568,937 5,568,960 17.96
Average earning assets 5,753,997 4,798,987 19.90
Common equity 893,259 740,391 20.65
Associates (FTE’s) 5,906 5,740 2.89
Shares outstanding (000s) 65,369 66,325 (1.44)
Common stockholders of record 10,585 14,562 (27.31)
(1) The earnings per share amounts and the price/earnings ratio prior to 1997 have been restated as required to comply with
Statement of Financial Accounting Standards No. 128, Earnings Per Share. For further discussion of earnings per share and
the impact of Statement 128, see the Notes to Consolidated Financial Statements.
Financial Summary
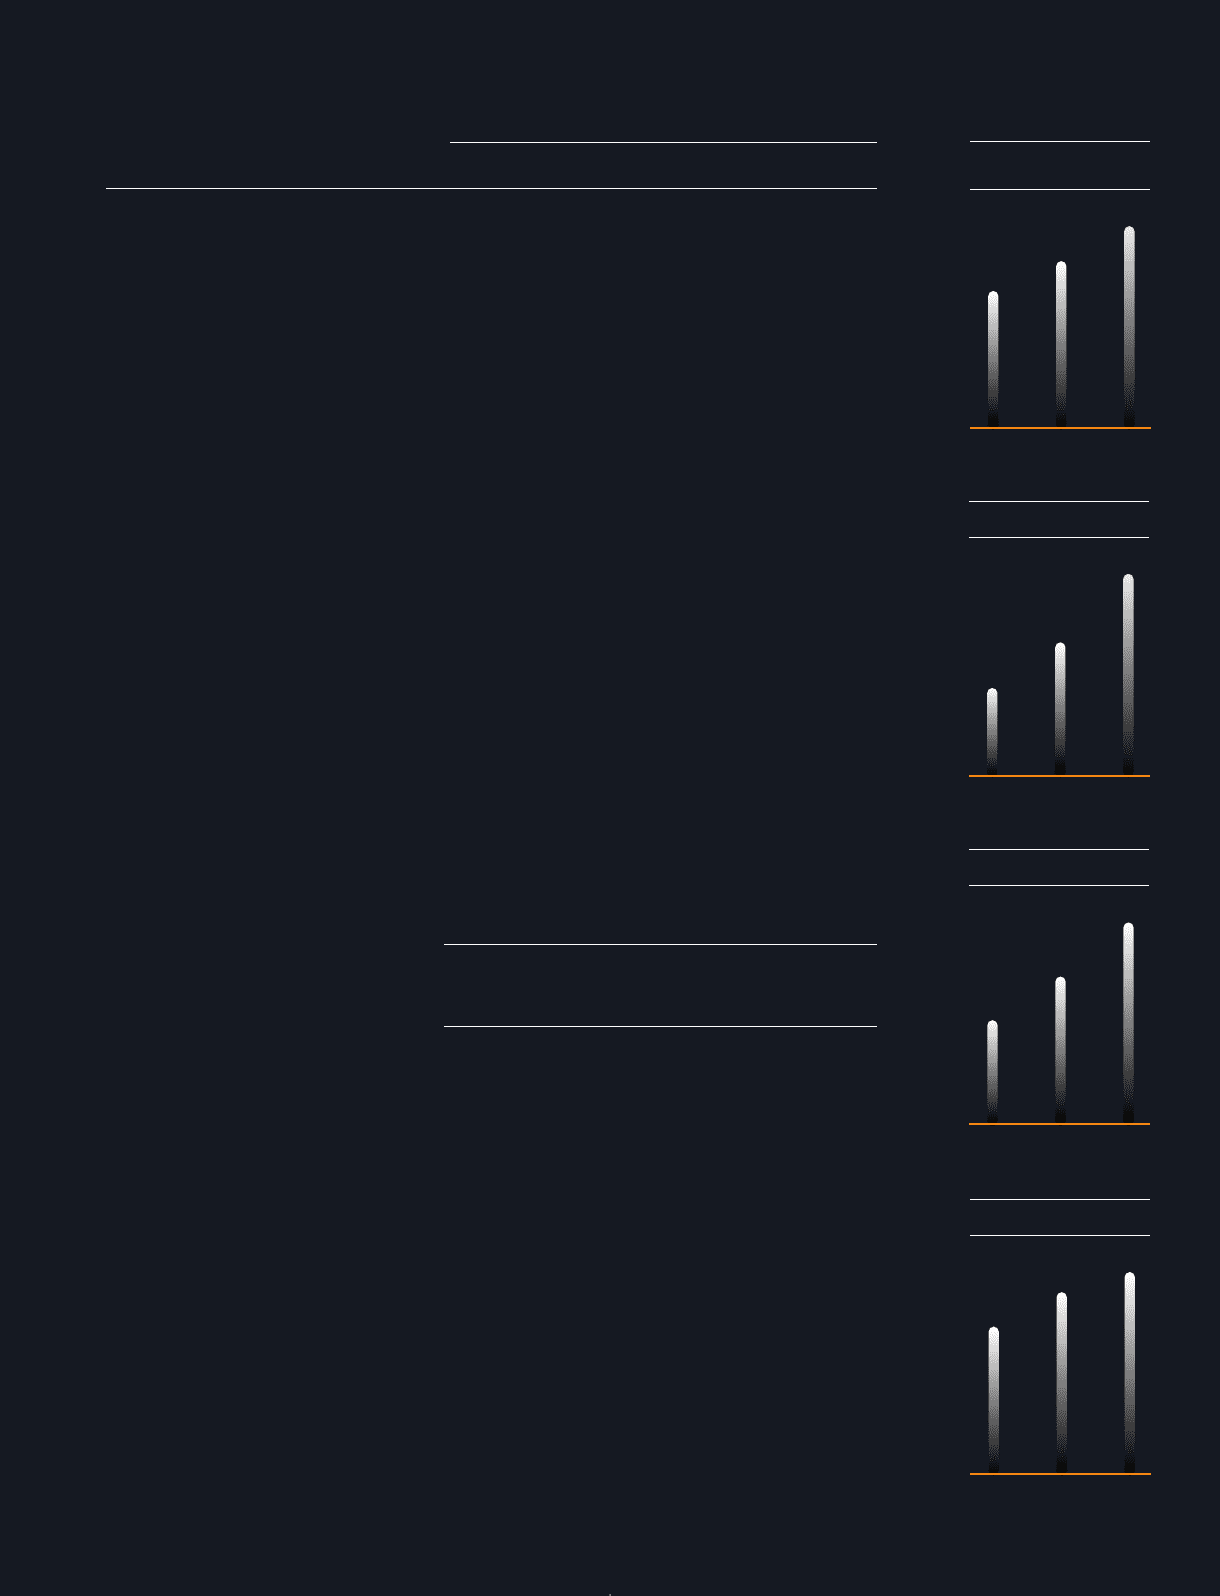
$1.91
Diluted earnings
Per Share
$2.32
$2.80
95 96 97
$23.88
Year-end Stock Price
$36.00
$54.19
95 96 97
6.1
Total Accounts
(in millions)
8.6
11.7
95 96 97
10.4
Managed Loans
(in billions)
12.8
14.2
95 96 97
PAGE 1