Capital One 1997 Annual Report Download - page 45
Download and view the complete annual report
Please find page 45 of the 1997 Capital One annual report below. You can navigate through the pages in the report by either clicking on the pages listed below, or by using the keyword search tool below to find specific information within the annual report.-
 1
1 -
2
-
3
-
4
-
5
-
6
-
7
-
8
-
9
-
10
-
11
-
12
-
13
-
14
-
15
-
16
-
17
-
18
-
19
-
20
-
21
-
22
-
23
-
24
-
25
-
26
-
27
-
28
-
29
-
30
-
31
-
32
-
33
-
34
-
 35
35 -
 36
36 -
 37
37 -
 38
38 -
 39
39 -
 40
40 -
 41
41 -
 42
42 -
 43
43 -
 44
44 -
 45
45 -
 46
46 -
 47
47 -
 48
48 -
 49
49 -
 50
50 -
 51
51 -
 52
52 -
 53
53 -
 54
54 -
 55
55 -
56
-
57
-
58
 |
 |

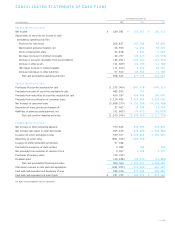
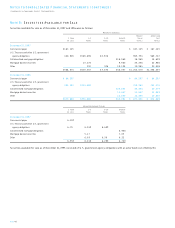
Consolidated Statements of Cash Flows
Year Ended December 31
(In Thousands) 1997 1996 1995
Operating Activities:
Net income $ 189,381 $ 155,267 $ 126,511
Adjustments to reconcile net income to cash
provided by operating activities:
Provision for loan losses 262,837 167,246 65,895
Depreciation and amortization, net 46,550 41,894 33,424
Stock compensation plans 24,878 7,921 4,020
Decrease (increase) in interest receivable 26,707 (23,017) (40,958)
Increase in accounts receivable from securitizations (86,261) (143,141) (122,364)
Increase in other assets (41,469) (24,795) (11,786)
(Decrease) increase in interest payable (11,914) 6,431 64,667
Increase (decrease) in other liabilities 97,914 89,964 (4,780)
Net cash provided by operating activities 508,623 277,770 114,629
Investing Activities:
Purchases of securities available for sale (1,275,900) (947,478) (400,117)
Proceeds from sales of securities available for sale 483,592 773
Proceeds from maturities of securities available for sale 450,787 490,040 100,000
Proceeds from securitization of consumer loans 2,114,695 2,695,000 3,525,000
Net increase in consumer loans (2,858,279) (4,251,269) (4,293,988)
Recoveries of loans previously charged off 27,462 13,300 13,353
Additions of premises and equipment, net (51,602) (74,871) (61,623)
Net cash used for investing activities (1,109,245) (2,074,505) (1,117,375)
Financing Activities:
Net increase in interest-bearing deposits 370,632 246,985 243,836
Net increase (decrease) in other borrowings 265,129 (278,820) (1,230,885)
Issuances of senior and deposit notes 529,977 2,105,864 2,469,869
Maturities of senior notes (891,436) (603,500)
Issuance of preferred beneficial interests 97,428
Proceeds from exercise of stock options 4,082 186 132
Net proceeds from issuances of common stock 4,957 3,109 1,257
Purchases of treasury stock (50,762)
Dividends paid (20,638) (20,573) (15,883)
Net cash provided by financing activities 309,369 1,453,251 1,468,326
(Decrease) increase in cash and cash equivalents (291,253) (343,484) 465,580
Cash and cash equivalents at beginning of year 528,976 872,460 406,880
Cash and cash equivalents at end of year $ 237,723 $ 528,976 $ 872,460
See Notes to Consolidated Financial Statements.
PAGE 43