Capital One 1997 Annual Report Download - page 27
Download and view the complete annual report
Please find page 27 of the 1997 Capital One annual report below. You can navigate through the pages in the report by either clicking on the pages listed below, or by using the keyword search tool below to find specific information within the annual report.-
 1
1 -
2
-
3
-
4
-
5
-
6
-
7
-
8
-
9
-
10
-
11
-
12
-
13
-
14
-
15
-
16
-
 17
17 -
 18
18 -
 19
19 -
 20
20 -
 21
21 -
 22
22 -
 23
23 -
 24
24 -
 25
25 -
 26
26 -
 27
27 -
 28
28 -
 29
29 -
 30
30 -
 31
31 -
 32
32 -
 33
33 -
 34
34 -
 35
35 -
 36
36 -
 37
37 -
38
-
39
-
40
-
41
-
42
-
43
-
44
-
45
-
46
-
47
-
48
-
49
-
50
-
51
-
52
-
53
-
54
-
55
-
56
-
57
-
58
 |
 |

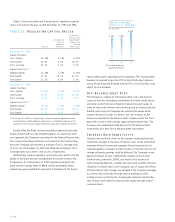
to select, print and mail the Company’s product offerings to poten-
tial and existing consumers utilizing its IBS and account manage-
ment techniques. All other non-interest expenses increased $78.4
million, or 27%, to $369.8 million in 1997 compared to $291.4
million in 1996.The increase in other non-interest expenses was
primarily a result of a 33% increase in the average number of
accounts for the year ended December 31, 1997, which resulted in
a corresponding increase in infrastructure and other operational
costs, offset by efficiencies gained from improved processes and
investments in information technology.
Non-interest expense for the year ended December 31, 1996
increased $215.8 million, or 43%, to $713.2 million from $497.4
million for the year ended December 31, 1995. Contributing to the
increase in non-interest expense were marketing expenses which
increased $59.8 million, or 41%, to $206.6 million in 1996 from
$146.8 million in 1995. All other non-interest expenses increased
$156.0 million, or 44%, to $506.6 million for the year ended
December 31, 1996 from $350.6 million in 1995.The increase in
other non-interest expense, including salaries and associate bene-
fits, was primarily a result of a 30% increase in the average number
of accounts for the year ended December 31, 1996. Other factors
impacting 1996 non-interest expense levels include a product mix
shift to more service-intensive, second generation accounts, addi-
tional staff associated with building infrastructure, an increase in
charge volume and an increase in certain costs associated with
information systems enhancements.
The Year 2000 compliance issue, which is common to most com-
panies, concerns the improper storage and manipulation of date
fields within software applications, systems, databases and hard-
ware. In April 1996, the Company formed a Year 2000 project team
to identify software systems and computer-related devices that
require modification for the Year 2000. A project plan has been
developed, and is well under way, with goals and target dates.The
Company expects to have all systems and applications in place and
fully tested by the end of 1998, allowing time in 1999 for any sys-
tems refinements that may be needed.
24% for the year ended December 31, 1996 compared to 1995. Net
interest income on securitized loans increased $226.1 million, or
54%, to $648.1 million for the year ended December 31, 1996 from
$422.0 million for the year ended December 31, 1995, primarily as a
result of loan growth and an increase in the securitized portfolio’s
net interest margin to 8.51% in 1996 versus 6.86% in 1995.This
increase in net interest margin was the result of an increase in yield
on securitized loans of 114 basis points for the year ended Decem-
ber 31, 1996, which was a result of repricing introductory rate
accounts, and decreased cost of funds on securitized loans of 51
basis points as short-term rates declined from the prior year.
Charge-offs on securitized loans for the year ended December 31,
1996 increased $199.9 million, or 138%, compared to the prior year
due to the increase in average securitized loans, worsening con-
sumer credit and seasoning of the portfolio.
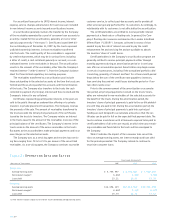
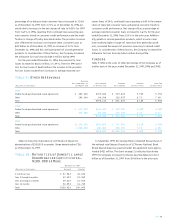
Other Non-Interest Income
Interchange income decreased $2.4 million, or 5%, to $49.0 million
for the year ended December 31, 1997 from $51.4 million in 1996 as
a result of the securitization of a higher percentage of more fee-
intensive second generation products in 1997 compared with 1996.
Other reported non-interest income, excluding interchange,
increased to $337.8 million, or 34%, for the year ended
December 31, 1997 compared to $252.2 million for the year ended
December 31, 1996.This increase was due to a 33% increase in the
average number of accounts for the year ended December 31, 1997
from 1996 and changes in the terms of overlimit fees charged.
Managed other non-interest income increased $283.0 million,
or 61%, exclusive of the impact resulting from the implementation
of SFAS 125, for the year ended December 31, 1997, primarily due
to loan and account growth of second generation products and
changes in the terms of overlimit fees charged.
Other reported non-interest income increased to $303.6 million,
or 112%, for the year ended December 31, 1996 compared to
$143.1 million for the year ended December 31, 1995.The increase
in other non-interest income was due to a 30% increase in the aver-
age number of accounts for the year ended December 31, 1996 from
1995, an increase in charge volume, a shift to more fee intensive
second generation products and changes in the terms of overlimit
fees charged.
Non-Interest Expense
Non-interest expense for the year ended December 31, 1997
increased $170.8 million, or 24%, to $884.0 million from $713.2
million for the year ended December 31, 1996. Contributing to the
increase in non-interest expense was salaries and associate benefits
expense, which increased $74.1 million, or 34%, to $289.3 million
in 1997 compared to $215.2 million in 1996.This increase reflected
additional staff associated with the cost of operations to manage
the growth in accounts and $17.0 million in additional expense asso-
ciated with the Company’s associate stock plans. Also contributing
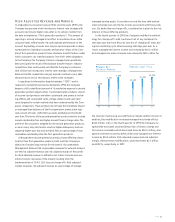
to the increase in non-interest expense was marketing expense
which increased $18.2 million, or 9%, to $224.8 million in 1997
from $206.6 million in 1996. Marketing expense represents the cost
PAGE 25
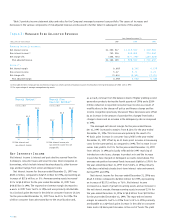
$147
Marketing Investment
(in millions)
$207
$225
95 96 97