Capital One 1997 Annual Report Download - page 21
Download and view the complete annual report
Please find page 21 of the 1997 Capital One annual report below. You can navigate through the pages in the report by either clicking on the pages listed below, or by using the keyword search tool below to find specific information within the annual report.-
 1
1 -
2
-
3
-
4
-
5
-
6
-
7
-
8
-
9
-
10
-
 11
11 -
 12
12 -
 13
13 -
 14
14 -
 15
15 -
 16
16 -
 17
17 -
 18
18 -
 19
19 -
 20
20 -
 21
21 -
 22
22 -
 23
23 -
 24
24 -
 25
25 -
 26
26 -
 27
27 -
 28
28 -
 29
29 -
 30
30 -
 31
31 -
32
-
33
-
34
-
35
-
36
-
37
-
38
-
39
-
40
-
41
-
42
-
43
-
44
-
45
-
46
-
47
-
48
-
49
-
50
-
51
-
52
-
53
-
54
-
55
-
56
-
57
-
58
 |
 |

PAGE 19
structure and manage the growth in accounts. Average managed
consumer loans grew 24% for the year ended December 31, 1996, to
$11.3 billion from $9.1 billion for the year ended December 31,
1995, and average managed accounts grew 30% for the same
period to 7.5 million from 5.7 million as a result of the continued
success of the Company’s marketing and account management
strategies.
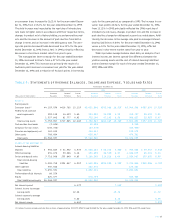
Managed Consumer Loan Portfolio
The Company analyzes its financial performance on a managed con-
sumer loan portfolio basis. Managed consumer loan data adjusts
the balance sheet and income statement to add back the effect of
securitizing consumer loans.The Company also evaluates its inter-
est rate exposure on a managed portfolio basis.
The Company’s managed consumer loan portfolio is comprised
of reported and securitized loans. Securitized loans are not assets
of the Company and, therefore, are not shown on the balance sheet.
Table 1 summarizes the Company’s managed consumer loan
portfolio.
Table 1: Managed Consumer Loan Portfolio
Year Ended December 31
(In Thousands) 1997 1996 1995 1994 1993
Year-End Balances:
Consumer loans held for securitization $ 400,000
On-balance sheet consumer loans $ 4,861,687 $ 4,343,902 2,521,679 $2,228,455 $1,862,744
Securitized consumer loans 9,369,328 8,460,067 7,523,801 5,150,000 2,969,656
Total managed consumer loan portfolio $14,231,015 $12,803,969 $10,445,480 $7,378,455 $4,832,400
Average Balances:
Consumer loans held for securitization $ 98,838 $ 699,044 $ 402,602 $ 432,581 $ 393,835
On-balance sheet consumer loans 4,004,198 2,952,864 2,537,606 1,854,103 1,819,543
Securitized consumer loans 8,904,146 7,616,553 6,149,070 3,910,739 1,052,187
Total managed consumer loan portfolio $13,007,182 $11,268,461 $ 9,089,278 $6,197,423 $3,265,565
As of December 31, 1997, the managed consumer loan portfolio
consisted of 62% fixed and 38% variable interest rate loans.The
Company’s reported consumer loan portfolio as of December 31,
1997 consisted of 58% fixed and 42% variable interest rate loans.
Since 1990, the Company has actively engaged in consumer loan
securitization transactions. In June 1996, the Financial Accounting
Standards Board (“FASB”) issued Statement of Financial
Accounting Standards (“SFAS”) No. 125, “Accounting for Trans-
fers and Servicing of Financial Assets and Extinguishments of Lia-
bilities” (“SFAS 125”), which was effective January 1, 1997. Under
SFAS 125, the Company records gains or losses on the securitiza-
tion of consumer loan receivables based on the estimated fair value
of assets obtained and liabilities incurred in the sale. Gains repre-
sent the present value of estimated cash flows the Company has
retained over the estimated outstanding period of the receivables.
This excess cash flow essentially represents an “interest only”
(“I/O”) strip, consisting of the excess of finance charges and past-
due fees over the sum of the return paid to certificateholders, esti-
mated contractual servicing fees and credit losses. However,
exposure to credit losses on the securitized loans is contractually
limited to these excess cash flows.The incremental effect of apply-
ing the new requirements, was to increase servicing and securitiza-
tions income in 1997 by $32.0 million ($19.8 million net of tax).
Certain estimates inherent in the determination of the fair value of
the I/O strip are influenced by factors outside the Company’s con-
trol, and as a result, such estimates could materially change in the
near term. Any future gains that will be recognized in accordance
with SFAS 125 will be dependent on the timing and amount of
future securitizations.The Company will continuously assess the
performance of new and existing securitization transactions as esti-
mates of future cash flows change.
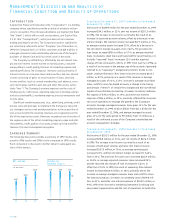
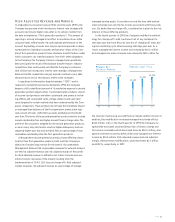
Managed Loans
(in billions)
$14.2
$12.8
$7.4
$10.4
$4.8
93 9594 9796