Capital One 1997 Annual Report Download - page 31
Download and view the complete annual report
Please find page 31 of the 1997 Capital One annual report below. You can navigate through the pages in the report by either clicking on the pages listed below, or by using the keyword search tool below to find specific information within the annual report.-
 1
1 -
2
-
3
-
4
-
5
-
6
-
7
-
8
-
9
-
10
-
11
-
12
-
13
-
14
-
15
-
16
-
17
-
18
-
19
-
20
-
 21
21 -
 22
22 -
 23
23 -
 24
24 -
 25
25 -
 26
26 -
 27
27 -
 28
28 -
 29
29 -
 30
30 -
 31
31 -
 32
32 -
 33
33 -
 34
34 -
 35
35 -
 36
36 -
 37
37 -
 38
38 -
 39
39 -
 40
40 -
 41
41 -
42
-
43
-
44
-
45
-
46
-
47
-
48
-
49
-
50
-
51
-
52
-
53
-
54
-
55
-
56
-
57
-
58
 |
 |

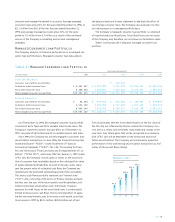
percentage of on-balance sheet consumer loans increased to 3.76%
as of December 31, 1997 from 2.73% as of December 31, 1996 pri-
marily due to increases in the net charge-off rate to 4.83% for 1997
from 3.63% in 1996, resulting from continued loan seasoning, gen-
eral economic trends in consumer credit performance and the modi-
fication in charge-off policy described earlier.The provision increase
also reflected the increase in on-balance sheet consumer loans to
$4.9 billion as of December 31, 1997, an increase of 12% from
December 31, 1996 and the continued growth of second generation
products. In consideration of these factors, the Company increased
the allowance for loan losses by $64.5 million during 1997.
For the year ended December 31, 1996, the provision for loan
losses increased to $167.2 million, or 154%, from the 1995 provi-
sion for loan losses of $65.9 million.The increase in the provision
for loan losses resulted from increases in average reported con-
sumer loans of 24%, continued loan seasoning, a shift in the compo-
sition of reported consumer loans and general economic trends in
consumer credit performance. Net charge-offs as a percentage of
average reported consumer loans increased to 3.63% for the year
ended December 31, 1996 from 2.03% in the prior year. Addition-
ally, growth in second generation products, which in some cases
have modestly higher charge-off rates than first generation prod-
ucts, increased the amount of provision necessary to absorb credit
losses. In consideration of these factors, the Company increased the
allowance for loan losses by $46.5 million during 1996.
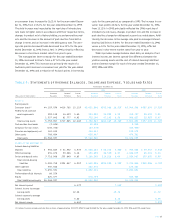
Funding
Table 9 reflects the costs of other borrowings of the Company as of
and for each of the years ended December 31, 1997, 1996 and 1995.
PAGE 29
Table 9: Other Borrowings
Maximum
Outstanding As Of Outstanding Average Average Year-End
(Dollars in Thousands) Any Month-End As Of Year-End Outstanding Interest Rate Interest Rate
1997
Federal funds purchased and resale agreements $ 999,200 $705,863 $ 503,843 5.54% 5.75%
Other 160,144 90,249 128,033 8.71 7.09
Total $796,112 $ 631,876 6.18% 5.90%
1996
Federal funds purchased and resale agreements $ 617,303 $445,600 $ 342,354 5.63% 6.26%
Other 207,689 85,383 112,545 8.20 6.43
Total $530,983 $ 454,899 6.27% 6.29%
1995
Federal funds purchased and resale agreements $1,146,678 $709,803 $ 747,350 6.14% 5.76%
Other 1,000,000 100,000 280,725 7.24 6.03
Total $809,803 $1,028,075 6.44% 5.79%
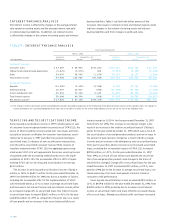
Table 10 shows the maturation of certificates of deposit in
denominations of $100,000 or greater (large denomination CDs)
as of December 31, 1997.
Table 10: Maturities of Domestic Large
Denomination Certificates—
$100,000 or More
December 31, 1997
(Dollars in Thousands) Balance Percent
3 months or less $ 97,363 42.62%
Over 3 through 6 months 43,523 19.06%
Over 6 through 12 months 49,210 21.54%
Over 12 months 38,332 16.78%
Total $228,428 100.00%
In September 1997, the Savings Bank completed the purchase of
the national retail deposit franchise of JCPenney National Bank.
Retail deposit balances acquired under the agreement were approx-
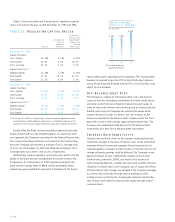
imately $421 million.The chart on page 31 indicates that during
1997 the Company increased its interest-bearing deposits to $1.3
billion as of December 31, 1997 from $.9 billion in the prior year.