Capital One 1997 Annual Report Download - page 24
Download and view the complete annual report
Please find page 24 of the 1997 Capital One annual report below. You can navigate through the pages in the report by either clicking on the pages listed below, or by using the keyword search tool below to find specific information within the annual report.-
 1
1 -
2
-
3
-
4
-
5
-
6
-
7
-
8
-
9
-
10
-
11
-
12
-
13
-
 14
14 -
 15
15 -
 16
16 -
 17
17 -
 18
18 -
 19
19 -
 20
20 -
 21
21 -
 22
22 -
 23
23 -
 24
24 -
 25
25 -
 26
26 -
 27
27 -
 28
28 -
 29
29 -
 30
30 -
 31
31 -
 32
32 -
 33
33 -
 34
34 -
35
-
36
-
37
-
38
-
39
-
40
-
41
-
42
-
43
-
44
-
45
-
46
-
47
-
48
-
49
-
50
-
51
-
52
-
53
-
54
-
55
-
56
-
57
-
58
 |
 |
PAGE 22
Net Interest Income
Net interest income is interest and past-due fees earned from the
Company’s consumer loans and securities less interest expense on
borrowings, which include interest-bearing deposits, other borrow-
ings and borrowings from senior and deposit notes.
Net interest income for the year ended December 31, 1997 was
$383.1 million, compared to $365.5 million for 1996, representing an
increase of $17.6 million, or 5%. Average earning assets increased
20% to $5.8 billion for the year ended December 31, 1997 from
$4.8 billion in 1996.The reported net interest margin decreased to
6.66% in 1997 from 7.62% in 1996 and was primarily attributable
to a 110 basis point decrease in the yield on consumer loans to 15.11%
for the year ended December 31, 1997 from 16.21% for 1996.The
yield on consumer loans decreased due to the securitization and,
as a result, removal from the balance sheet of higher yielding second
generation products during the fourth quarter of 1996 and a $24.4
million reduction in reported consumer loan income as a result of
modifications in the charge-off policy and finance charge and fee
income recognition previously discussed.These decreases were offset
by an increase in the amount of past-due fees charged from both a
change in terms and an increase in the delinquency rate as compared
to 1996.
The managed net interest margin for the year ended Decem-
ber 31, 1997 increased to 8.86% from 8.16% for the year ended
December 31, 1996.This increase was primarily the result of a
97 basis point increase in consumer loan yield for the year ended
December 31, 1997 offset by an 11 basis point increase in borrowing
costs for the same period, as compared to 1996.The increase in con-
sumer loan yield to 15.73% for the year ended December 31, 1997
from 14.76% in 1996 principally reflected the 1997 repricing of
introductory rate loans, changes in product mix and the increase
in past-due fees charged on delinquent accounts noted above.The
average rate paid on borrowed funds increased slightly to 5.95% for
the year ended December 31, 1997 from 5.84% in 1996 primarily
reflecting a relatively steady short-term interest rate environment
during 1997 and 1996.
Net interest income for the year ended December 31, 1996 was
$365.5 million compared to $208.0 million for 1995, representing
an increase of $157.5 million, or 76%. Net interest income
increased as a result of growth in earning assets and an increase in
the net interest margin. Average earning assets increased 23% for
the year ended December 31, 1996 to $4.8 billion from $3.9 billion
for the year ended December 31, 1995.The reported net interest
margin increased to 7.62% in 1996 from 5.35% in 1995 primarily
attributable to a 269 basis point increase in the yield on consumer
loans and a 38 basis point decrease in the cost of funds.The yield
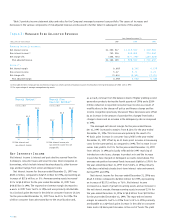
Table 3: Managed Risk Adjusted Revenue
Year Ended December 31
(Dollars in Thousands) 1997 1996 1995
Managed Income Statement:
Net interest income $1,299,317 $1,013,557 $(629,996
Non-interest income(1) 743,516 460,492 276,269
Net charge-offs (856,704) (477,732) (204,828)
Risk adjusted revenue $1,186,129 $ 996,317 $(701,437
Ratios(2):
Net interest margin 8.86% 8.16% 6.27%
Non-interest income 5.07 3.71 2.75
Net charge-offs (5.84) (3.85) (2.04)
Risk adjusted margin 8.09% 8.02% 6.98%
(1) Excludes the $32 million pre-tax incremental impact on credit card securitizations income resulting from the implementation of SFAS 125 in 1997.
(2) As a percentage of average managed earning assets.
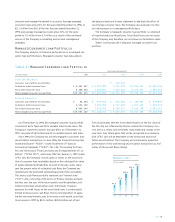
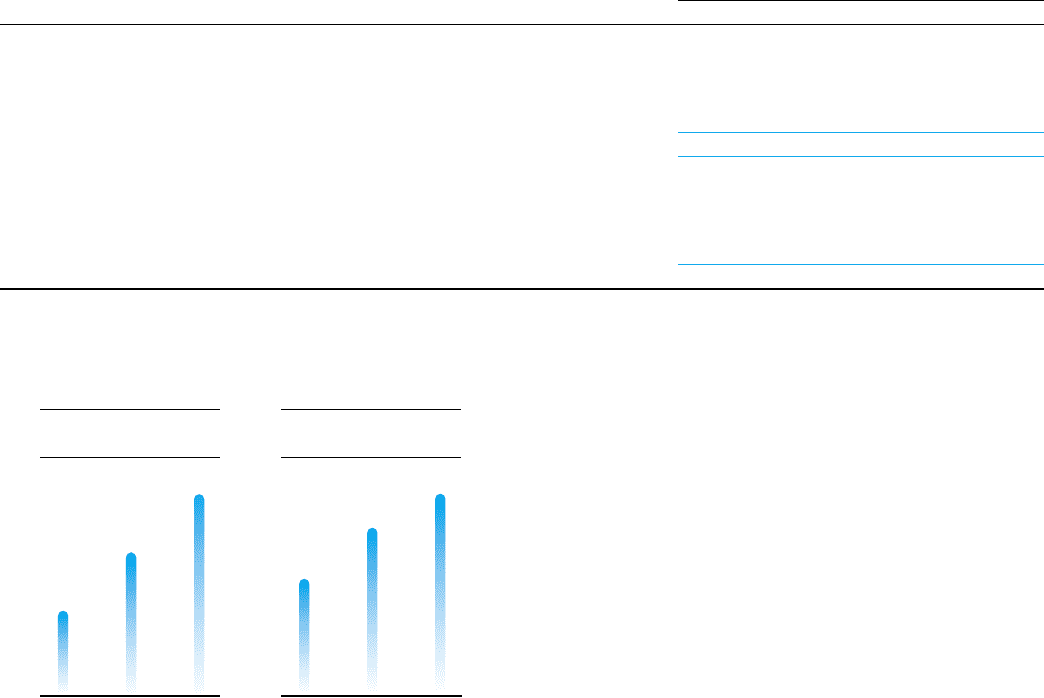
$0.9
Managed Revenue(1)
(in billions)
$1.5
$2.1
95 96 97
(1) Net interest and
non-interest income.
$0.7
Managed Risk
Adjusted Revenue(1)
(in billions)
$1.0
$1.2
95 96 97
(1) Net interest income plus
non-interest income less net
charge-offs.
Table 3 provides income statement data and ratios for the Company’s managed consumer loan portfolio.The causes of increases and
decreases in the various components of risk adjusted revenue are discussed in further detail in subsequent sections of this analysis.