Capital One 1997 Annual Report Download - page 19
Download and view the complete annual report
Please find page 19 of the 1997 Capital One annual report below. You can navigate through the pages in the report by either clicking on the pages listed below, or by using the keyword search tool below to find specific information within the annual report.-
 1
1 -
2
-
3
-
4
-
5
-
6
-
7
-
8
-
 9
9 -
 10
10 -
 11
11 -
 12
12 -
 13
13 -
 14
14 -
 15
15 -
 16
16 -
 17
17 -
 18
18 -
 19
19 -
 20
20 -
 21
21 -
 22
22 -
 23
23 -
 24
24 -
 25
25 -
 26
26 -
 27
27 -
 28
28 -
 29
29 -
30
-
31
-
32
-
33
-
34
-
35
-
36
-
37
-
38
-
39
-
40
-
41
-
42
-
43
-
44
-
45
-
46
-
47
-
48
-
49
-
50
-
51
-
52
-
53
-
54
-
55
-
56
-
57
-
58
 |
 |

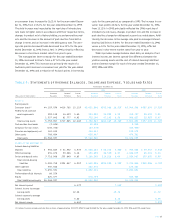
Selected Financial and Operating Data
Year Ended December 31
Five-Year
(Dollars in Thousands, Compound
Except Per Share Data) 1997 1996 1995 1994(1) 1993(1) 1992(1) Growth Rate
Income Statement Data:
Interest income $ 717,985 $ 660,483 $ 457,409 $ 258,672 $ 259,857 $ 120,630 42.87%
Interest expense 334,847 294,999 249,396 93,695 67,994 29,888 62.13
Net interest income 383,138 365,484 208,013 164,977 191,863 90,742 33.39
Provision for loan losses 262,837 167,246 65,895 30,727 34,030 55,012 36.72
Net interest income after
provision for loan losses 120,301 198,238 142,118 134,250 157,833 35,730 27.48
Non-interest income 1,069,130 763,424 553,043 396,902 194,825 121,642 54.45
Non-interest expense(2) 883,978 713,182 497,430 384,325 181,804 108,508 52.12
Income before income taxes 305,453 248,480 197,731 146,827 170,854 48,864 44.27
Income taxes 116,072 93,213 71,220 51,564 60,369 16,614 47.52
Net income $ 189,381 $ 155,267 $ 126,511 $ 95,263 $ 110,485 $ 32,250 42.48
Dividend payout ratio 10.90% 13.24% 12.55%
Per Common Share:
Basic earnings(3) (4) $ 2.87 $ 2.34 $ 1.93 $ 1.44 $ 1.67 $ .49
Diluted earnings(3) (4) 2.80 2.32 1.91 1.44 1.67 .49
Dividends .32 .32 .24
Book value as of year-end 13.66 11.16 9.05 7.18
Average common shares 66,069,897 66,227,631 65,690,838 66,067,250
Average common and common
equivalent shares 67,650,864 67,025,233 66,392,284 66,067,250
Selected Average
Balances:
Securities $ 1,650,961 $ 1,147,079 $ 962,624 $ 62,626
Allowance for loan losses (132,728) (83,573) (69,939) (66,434) $ (59,754) $ (43,767) 24.84%
Total assets 6,568,937 5,568,960 4,436,055 2,629,920 2,289,043 827,093 51.35
Deposits 958,885 1,046,122 769,688 36,248
Other borrowings 4,350,864 3,623,104 2,952,162 2,287,474 2,148,155 762,762 41.66
Preferred beneficial interests 89,529
Stockholders’/Division equity(5) 824,077 676,759 543,364 239,616 113,815 51,454 74.14
Selected Year-End
Balances:
Securities $ 1,475,354 $ 1,358,103 $ 1,244,195 $ 425,570
Consumer loans 4,861,687 4,343,902 2,921,679 2,228,455 $1,862,744 $1,304,560
Allowance for loan losses (183,000) (118,500) (72,000) (68,516) (63,516) (55,993)
Total assets 7,078,279 6,467,445 4,759,321 3,091,980 1,991,207 1,351,802
Deposits 1,313,654 943,022 696,037 452,201
Other borrowings 4,428,886 4,525,216 3,301,672 2,062,688 1,791,464 1,266,507
Preferred beneficial interests 97,664
Stockholders’/Division equity(5) 893,259 740,391 599,191 474,557 168,879 69,294
Managed Consumer
Loan Data:
Average reported loans $ 4,103,036 $ 3,651,908 $ 2,940,208 $ 2,286,684 $2,213,378 $ 772,742 39.64%
Average securitized loans 8,904,146 7,616,553 6,149,070 3,910,739 1,052,187 680,000 67.27
Average total managed loans 13,007,182 11,268,461 9,089,278 6,197,423 3,265,565 1,452,742 55.02
Interest income 2,045,967 1,662,990 1,192,100 733,659 432,521 249,082 52.37
Year-end total managed loans 14,231,015 12,803,969 10,445,480 7,378,455 4,832,400 1,984,560 48.29
Year-end total accounts (000s) 11,747 8,586 6,149 5,049 3,118 1,672 47.69
Yield 15.73% 14.76% 13.12% 11.84% 13.24% 17.15%
Net interest margin 8.86 8.16 6.27 6.90 9.55 12.63
Delinquency rate 6.20 6.24 4.20 2.95 2.39 5.30
Net charge-off rate 6.59 4.24 2.25 1.48 2.09 5.18
Operating Ratios:
Return on average assets 2.88% 2.79% 2.85% 3.62% 4.83% 3.90%
Return on average equity 22.98 22.94 23.28 39.76 97.07 62.68
Equity to assets (average) 12.55 12.15 12.25 9.11 4.97 6.22
Allowance for loan losses to loans
as of year-end(6) 3.76 2.73 2.85 3.07 3.41 4.29
(1) The Company’s results prior to November 22, 1994, reflect operations as a division of Signet Bank. Prior to November 22, 1994, Signet Banking Corporation, the parent of
Signet Bank, had provided significant financial and operational support to the Company.
(2) Non-interest expense includes a $49.0 million ($31.9 million after-tax) nonrecurring charge for computer services termination expense in 1994.
(3) Assumes 66,067,250 shares outstanding prior to November 22, 1994.
(4) The earnings per share amounts prior to 1997 have been restated as required to comply with Statement of Financial Accounting Standards No. 128, Earnings Per Share.
For further discussion of earnings per share and the impact of Statement 128, see the Notes to Consolidated Financial Statements.
(5) Division equity reflects an allocation of capital to Capital One Bank as a division for purposes of preparation of the financial statements of the Company. Such allocation
is not subject to regulatory minimums.
(6) Excludes consumer loans held for securitization.
PAGE 17