Capital One 1997 Annual Report Download - page 53
Download and view the complete annual report
Please find page 53 of the 1997 Capital One annual report below. You can navigate through the pages in the report by either clicking on the pages listed below, or by using the keyword search tool below to find specific information within the annual report.-
 1
1 -
2
-
3
-
4
-
5
-
6
-
7
-
8
-
9
-
10
-
11
-
12
-
13
-
14
-
15
-
16
-
17
-
18
-
19
-
20
-
21
-
22
-
23
-
24
-
25
-
26
-
27
-
28
-
29
-
30
-
31
-
32
-
33
-
34
-
35
-
36
-
37
-
38
-
39
-
40
-
41
-
42
-
 43
43 -
 44
44 -
 45
45 -
 46
46 -
 47
47 -
 48
48 -
 49
49 -
 50
50 -
 51
51 -
 52
52 -
 53
53 -
 54
54 -
 55
55 -
 56
56 -
 57
57 -
 58
58
 |
 |

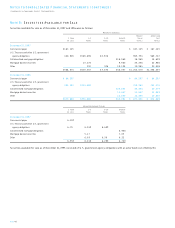
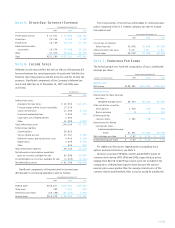
Note G: Other Non-Interest Expense
Year Ended December 31
1997 1996 1995
Professional services $ 47,671 $ 43,968 $28,787
Collections 23,216 9,783 7,193
Fraud losses 16,749 26,773 27,721
Bankcard association
assessments 16,074 15,045 13,116
Other 47,570 36,614 20,726
Total $151,280 $132,183 $97,543
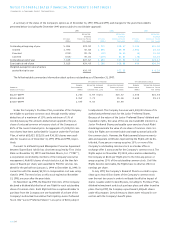
Note H: Income Taxes
Deferred income taxes reflect the net tax effects of temporary dif-
ferences between the carrying amounts of assets and liabilities for
financial reporting purposes and the amounts used for income tax
purposes. Significant components of the Company’s deferred tax
assets and liabilities as of December 31, 1997 and 1996 were
as follows:
December 31
1997 1996
Deferred tax assets:
Allowance for loan losses $ 60,900 $41,475
Finance charge and fee income receivables 17,570
Stock incentive plan 11,466 2,758
Unearned membership fees 5,600 310
State taxes, net of federal benefit 2,694
Other 11,290 7,232
Total deferred tax assets 109,520 51,775
Deferred tax liabilities:
Securitizations 26,822
Service charge accrual 10,167 5,368
Deferred issuance and replacement costs 4,442 3,119
Depreciation 4,235 2,546
Other 456 542
Total deferred tax liabilities 46,122 11,575
Net deferred tax assets before unrealized
gains on securities available for sale 63,398 40,200
Unrealized gains on securities available for sale (1,602) (1,121)
Net deferred tax assets $ 61,796 $39,079
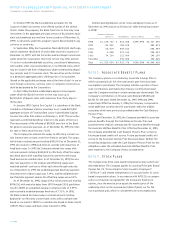
Significant components of the provision for income taxes
attributable to continuing operations were as follows:
Year Ended December 31
1997 1996 1995
Federal taxes $138,877 $119,027 $63,162
State taxes 393 1,715 600
Deferred income taxes (23,198) (27,529) 7,458
Income taxes $116,072 $ 93,213 $71,220
The reconciliation of income tax attributable to continuing oper-
ations computed at the U.S. federal statutory tax rate to income
tax expense was:
Year Ended December 31
1997 1996 1995
Income tax at statutory
federal tax rate 35.00% 35.00% 35.00%
Other, primarily state taxes 3.00 2.50 1.00
Income taxes 38.00% 37.50% 36.00%
Note I: Earnings Per Share
The following table sets forth the computation of basic and diluted
earnings per share:
Year Ended December 31
(Shares in Thousands) 1997 1996 1995
Numerator:
Net income $189,381 $155,267 $126,511
Denominator:
Denominator for basic earnings
per share—
Weighted-average shares 66,070 66,228 65,691
Effect of dilutive securities:
Stock options 1,578 790 391
Restricted stock 38 310
Dilutive potential
common shares 1,581 798 701
Denominator for diluted
earnings per share—
Adjusted weighted-average
shares 67,651 67,026 66,392
Basic earnings per share $ 2.87 $ 2.34 $ 1.93
Diluted earnings per share $ 2.80 $ 2.32 $ 1.91
For additional disclosures regarding the outstanding stock
options and restricted stock, see Note F.
Options to purchase 949,484; 20,725 and 829,855 shares of
common stock during 1997, 1996 and 1995, respectively, at prices
ranging from $23.38 to $47.94 per share, were not included in the
computation of diluted earnings per share because the options’
exercise prices were greater than the average market price of the
common shares and, therefore, their inclusion would be antidilutive.
PAGE 51