Capital One 1997 Annual Report Download - page 29
Download and view the complete annual report
Please find page 29 of the 1997 Capital One annual report below. You can navigate through the pages in the report by either clicking on the pages listed below, or by using the keyword search tool below to find specific information within the annual report.-
 1
1 -
2
-
3
-
4
-
5
-
6
-
7
-
8
-
9
-
10
-
11
-
12
-
13
-
14
-
15
-
16
-
17
-
18
-
 19
19 -
 20
20 -
 21
21 -
 22
22 -
 23
23 -
 24
24 -
 25
25 -
 26
26 -
 27
27 -
 28
28 -
 29
29 -
 30
30 -
 31
31 -
 32
32 -
 33
33 -
 34
34 -
 35
35 -
 36
36 -
 37
37 -
 38
38 -
 39
39 -
40
-
41
-
42
-
43
-
44
-
45
-
46
-
47
-
48
-
49
-
50
-
51
-
52
-
53
-
54
-
55
-
56
-
57
-
58
 |
 |

PAGE 27
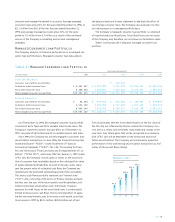
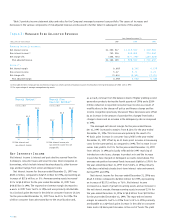
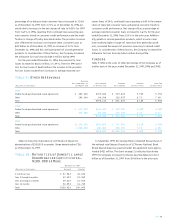
modified its methodology for charging off credit card loans (net of
any collateral) to 180 days past-due from the prior practice of
charging off loans during the next billing cycle after becoming 180
days past-due.The impact of this modification was to increase
reported and managed charge-offs by $11.5 million and $47.4 mil-
lion, respectively. For the year ended December 31, 1997, net charge-
offs of managed consumer loans increased 79% while average
managed consumer loans grew 15%.The increase in net charge-
offs was the result of continued seasoning of accounts and con-
sumer loan balances, general economic trends in consumer credit
performance and the modification to the charge-off policy
described above.Table 7 shows the Company’s net charge-offs for
the years presented on a reported and managed basis.
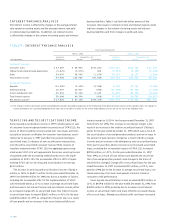
For the year ended December 31, 1997, the Company’s managed
net charge-offs as a percentage of average managed loans was
6.59% and, without the modification in charge-off policy, would
have been 6.22%.The Company’s objective is to optimize the prof-
itability of each account within acceptable risk characteristics.The
Company takes measures as necessary, including requiring
collateral on certain accounts and other marketing and account
management techniques, to maintain the Company’s credit quality
standards and to manage the risk of loss on existing accounts. See
“Risk Adjusted Revenue and Margin” for further discussion.
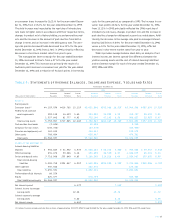
Table 6: Delinquencies(1)
December 31
1997 1996 1995 1994 1993
% of % of % of % of % of
Total Total Total Total Total
(Dollars in Thousands) Loans Loans Loans Loans Loans Loans Loans Loans Loans Loans
Reported:
Loans outstanding $ 4,861,687 100.00% $ 4,343,902 100.00% $ 2,921,679 100.00% $2,228,455 100.00% $1,862,744 100.00%
Loans delinquent:
30-59 days 104,216 2.14 96,819 2.23 65,711 2.25 29,032 1.30 19,186 1.03
60-89 days 64,217 1.32 55,679 1.28 38,311 1.31 14,741 .66 10,618 .57
90 or more days 99,667 2.05 111,791 2.57 79,694 2.73 24,445 1.10 18,255 .98
Total $ 268,100 5.51% $ 264,289 6.08% $ 183,716 6.29% $ 68,218 3.06% $ 48,059 2.58%
Managed:
Loans outstanding $14,231,015 100.00% $12,803,969 100.00% $10,445,480 100.00% $7,378,455 100.00% $4,832,400 100.00%
Loans delinquent:
30-59 days 327,407 2.30 279,787 2.19 165,306 1.58 90,733 1.23 46,391 .96
60-89 days 213,726 1.50 162,668 1.27 92,665 .89 45,277 .61 25,128 .52
90 or more days 340,887 2.40 356,700 2.78 181,243 1.73 81,720 1.11 43,975 .91
Total $ 882,020 6.20% $ 799,155 6.24% $ 439,214 4.20% $ 217,730 2.95% $ 115,494 2.39%
(1) Includes consumer loans held for securitization.
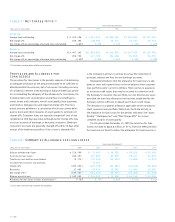
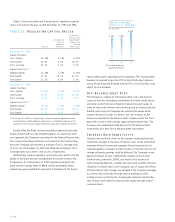
4.20%
Managed Net Charge-Off
Rate & 30+ Day
Delinquency Rate
6.24% 6.20%
2.25%
4.24%
6.59%
95 96 97(1)
(1) The net charge-off rate, without
the modification in charge-off
policy, would have been 6.22%.
The delinquency rate, without
the modification in charge-off
policy and finance charge and
fee income recognition, would
have been 6.97%.
● Net Charge-Off Rate
● Delinquency Rate