Capital One 1997 Annual Report Download - page 20
Download and view the complete annual report
Please find page 20 of the 1997 Capital One annual report below. You can navigate through the pages in the report by either clicking on the pages listed below, or by using the keyword search tool below to find specific information within the annual report.-
 1
1 -
2
-
3
-
4
-
5
-
6
-
7
-
8
-
9
-
 10
10 -
 11
11 -
 12
12 -
 13
13 -
 14
14 -
 15
15 -
 16
16 -
 17
17 -
 18
18 -
 19
19 -
 20
20 -
 21
21 -
 22
22 -
 23
23 -
 24
24 -
 25
25 -
 26
26 -
 27
27 -
 28
28 -
 29
29 -
 30
30 -
31
-
32
-
33
-
34
-
35
-
36
-
37
-
38
-
39
-
40
-
41
-
42
-
43
-
44
-
45
-
46
-
47
-
48
-
49
-
50
-
51
-
52
-
53
-
54
-
55
-
56
-
57
-
58
 |
 |

Introduction
Capital One Financial Corporation (the “Corporation”) is a holding
company whose subsidiaries provide a variety of products and ser-
vices to consumers.The principal subsidiaries are Capital One Bank
(the “Bank”), which offers credit card products, and Capital One,
F.S.B. (the “Savings Bank”), which provides certain consumer
lending and deposit services.The Corporation and its subsidiaries
are collectively referred to as the “Company.” As of December 31,
1997, the Company had 11.7 million customers and $14.2 billion in
managed consumer loans outstanding and was one of the largest
providers of MasterCard and Visa credit cards in the world.
The Company’s profitability is affected by the net interest mar-
gin and non-interest income earned on earning assets, consumer
usage patterns, credit quality, the level of marketing expense and
operating efficiency.The Company’s revenues consist primarily of
interest income on consumer loans and securities, and non-interest
income consisting of gains on securitization of loans, servicing
income and fees (such as annual membership, cash advance, cross-
sell, interchange, overlimit, past-due and other fee income, collec-
tively “fees”).The Company’s primary expenses are the costs of
funding assets, credit losses, operating expenses (including salaries
and associate benefits), marketing expense, processing expenses and
income taxes.
Significant marketing expenses (e.g., advertising, printing, credit
bureau costs and postage) to implement the Company’s new prod-
uct strategies are incurred and expensed prior to the acquisition of
new accounts while the resulting revenues are recognized over the
life of the acquired accounts. Revenues recognized are a function of
the response rate of the initial marketing program, usage and attri-
tion patterns, credit quality of accounts, product pricing and effec-
tiveness of account management programs.
Earnings Summary
The following discussion provides a summary of 1997 results com-
pared to 1996 results and 1996 results compared to 1995 results.
Each component is discussed in further detail in subsequent sec-
tions of this analysis.
Management’s Discussion and Analysis of
Financial Condition and Results of Operations
Year Ended December 31, 1997 Compared to Year ended
December 31, 1996
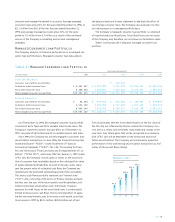
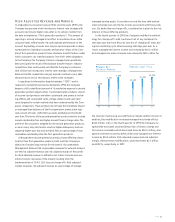
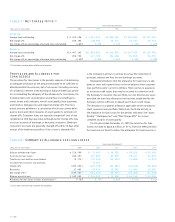
Net income of $189.4 million for the year ended December 31, 1997
increased $34.1 million, or 22%, over net income of $155.3 million
in 1996.The increase in net income is primarily the result of an
increase in asset and account volumes, offset by a decrease in net
interest margin. Net interest income increased $17.7 million, or 5%,
as average earning assets increased 20%, offset by a decrease in
the net interest margin to 6.66% from 7.62%.The provision for
loan losses increased $95.6 million, or 57%, as average reported
loans (on-balance sheet loans and loans held for securitization, col-
lectively “reported” loans) increased 12% and the reported
charge-off rate increased to 4.83% in 1997 from 3.63% in 1996, as
a result of an increase in the average age of the accounts (generally
referred to as “seasoning”) and general economic trends in con-
sumer credit performance. Non-interest income increased $305.7
million, or 40%, primarily as a result of the increase in average
managed accounts of 33%, a 17% increase in average securitized
loans, a shift to more fee-based accounts, a change in the timing
and amount (“terms”) of certain fees charged and the incremental
impact of securitization accounting. Increases in salaries and bene-
fits expense of $74.2 million, or 34%, and other non-interest
expenses of $96.6 million, or 19%, primarily reflected the incremen-
tal cost of operations to manage the growth in the Company’s
accounts. Average managed consumer loans grew 15% for the year
ended December 31, 1997, to $13.0 billion from $11.3 billion for the
year ended December 31, 1996, and average managed accounts
grew 33% for the same period to 9.9 million from 7.5 million as a
result of the continued success of the Company’s marketing and
account management strategies.
Year Ended December 31, 1996 Compared to Year Ended
December 31, 1995
Net income of $155.3 million for the year ended December 31, 1996
increased $28.8 million, or 23%, over net income of $126.5 million
in 1995.The increase in net income is primarily a result of an
increase in both asset volumes and rates. Net interest income
increased $157.5 million, or 76%, as average earning assets
increased 23% and the net interest margin increased to 7.62%
from 5.35%.The provision for loan losses increased $101.4 million,
or 154%, as average reported consumer loans increased 24%
and the reported net charge-off rate increased to 3.63% in
1996 from 2.03% in 1995, the result of seasoning. Non-interest
income increased $210.4 million, or 38%, primarily due to the
increase in average managed consumer loans and a shift to more
fee-intensive products. Increases in marketing costs of $59.8 mil-
lion, or 41%, and other non-interest expenses of $155.9 million, or
44%, reflect the increase in marketing investment in existing and
new product opportunities and the cost of operations to build infra-
PAGE 18
$127
Net Income
(in millions)
$155
$189
95 96 97
Return on
Average Equity
23%23%23%
20%
95 96 97