Capital One 1997 Annual Report Download - page 39
Download and view the complete annual report
Please find page 39 of the 1997 Capital One annual report below. You can navigate through the pages in the report by either clicking on the pages listed below, or by using the keyword search tool below to find specific information within the annual report.-
 1
1 -
2
-
3
-
4
-
5
-
6
-
7
-
8
-
9
-
10
-
11
-
12
-
13
-
14
-
15
-
16
-
17
-
18
-
19
-
20
-
21
-
22
-
23
-
24
-
25
-
26
-
27
-
28
-
 29
29 -
 30
30 -
 31
31 -
 32
32 -
 33
33 -
 34
34 -
 35
35 -
 36
36 -
 37
37 -
 38
38 -
 39
39 -
 40
40 -
 41
41 -
 42
42 -
 43
43 -
 44
44 -
 45
45 -
 46
46 -
 47
47 -
 48
48 -
 49
49 -
50
-
51
-
52
-
53
-
54
-
55
-
56
-
57
-
58
 |
 |

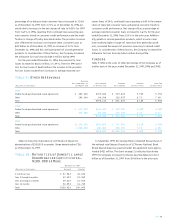
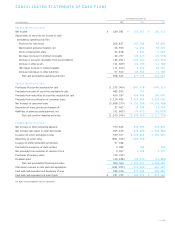
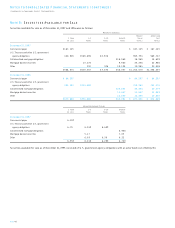
Selected Quarterly Financial Data
1997 1996
Fourth Third Second First Fourth Third Second First
(Unaudited) Quarter(1) Quarter Quarter Quarter Quarter Quarter Quarter Quarter
Summary Of Operations:
(In Thousands)
Interest income $203,551 $178,970 $166,870 $168,594 $201,353 $188,235 $137,753 $133,142
Interest expense 89,023 81,816 83,611 80,397 87,784 81,581 63,300 62,334
Net interest income 114,528 97,154 83,259 88,197 113,569 106,654 74,453 70,808
Provision for loan losses 94,356 72,518 46,776 49,187 63,035 53,933 25,110 25,168
Net interest income after
provision for loan losses 20,172 24,636 36,483 39,010 50,534 52,721 49,343 45,640
Non-interest income 316,098 280,933 229,042 243,057 214,961 206,716 170,599 171,148
Non-interest expense 242,373 226,003 202,055 213,547 200,575 196,823 159,334 156,450
Income before income taxes 93,897 79,566 63,470 68,520 64,920 62,614 60,608 60,338
Income taxes 35,680 30,236 24,118 26,038 24,670 23,793 22,425 22,325
Net income $ 58,217 $ 49,330 $ 39,352 $ 42,482 $ 40,250 $ 38,821 $ 38,183 $ 38,013
Per Common Share:
Basic earnings(2) $ .89 $ .75 $ .59 $ .64 $.61$.59$.58$.57
Diluted earnings(2) .86 .73 .58 .63 .60 .58 .57 .57
Dividends .08 .08 .08 .08 .08 .08 .08 .08
Market prices
High 543/16 453/400 397/8435/8365/8317/8321/8277/8
Low 441/83213/16 313/8331/4297/8257/8251/8217/8
Average common shares (000s) 65,535 66,185 66,428 66,336 66,287 66,250 66,210 66,157
Average common and common
equivalent shares (000s) 67,532 67,574 67,608 67,704 67,275 67,005 66,903 66,726
Average Balance Sheet Data:
(In Millions)
Consumer loans $ 4,508 $ 3,847 $ 3,997 $ 4,059 $ 4,648 $ 3,955 $ 3,249 $ 2,742
Allowance for loan losses (174) (123) (119) (120) (105) (81) (74) (74)
Securities 1,831 1,690 1,563 1,521 1,164 1,228 933 1,302
Other assets 899 1,143 1,117 939 929 990 793 721
Total assets $ 7,064 $ 6,557 $ 6,558 $ 6,399 $ 6,636 $ 6,092 $ 4,901 $ 4,691
Interest-bearing deposits $ 1,172 $ 852 $ 818 $ 993 $ 1,298 $ 1,234 $ 789 $ 859
Other borrowings 823 595 695 411 472 466 349 527
Senior and deposit notes 3,614 3,686 3,769 3,809 3,843 3,435 2,875 2,510
Other liabilities 465 485 380 357 290 259 244 164
Preferred beneficial interests 98 98 98 65
Stockholders’ equity 892 841 798 764 733 698 644 631
Total liabilities and equity $ 7,064 $ 6,557 $ 6,558 $ 6,399 $ 6,636 $ 6,092 $ 4,901 $ 4,691
The above schedule is a tabulation of the Company’s unaudited quarterly results for the years ended December 31, 1997 and 1996.The Company’s common shares are traded on the
New York Stock Exchange under the symbol COF. In addition, shares may be traded in the over-the-counter stock market. There were 10,585 and 14,562 common stockholders of
record as of December 31, 1997 and 1996, respectively.
(1) Includes the effect of the modications in charge-off policy and finance charge and fee income recognition which reduced interest income by $24.4 million and non-interest income
by $48.9 million, see Note A to Consolidated Financial Statements.
(2) The earnings per share amounts for the first three quarters of 1997 and for 1996 have been restated as required to comply with Statement of Financial Accounting Standards
No. 128, Earnings Per Share. For further discussion of earnings per share and the impact of Statement 128, see Note A to Consolidated Financial Statements.
PAGE 37