Capital One 1997 Annual Report Download - page 26
Download and view the complete annual report
Please find page 26 of the 1997 Capital One annual report below. You can navigate through the pages in the report by either clicking on the pages listed below, or by using the keyword search tool below to find specific information within the annual report.-
 1
1 -
2
-
3
-
4
-
5
-
6
-
7
-
8
-
9
-
10
-
11
-
12
-
13
-
14
-
15
-
 16
16 -
 17
17 -
 18
18 -
 19
19 -
 20
20 -
 21
21 -
 22
22 -
 23
23 -
 24
24 -
 25
25 -
 26
26 -
 27
27 -
 28
28 -
 29
29 -
 30
30 -
 31
31 -
 32
32 -
 33
33 -
 34
34 -
 35
35 -
 36
36 -
37
-
38
-
39
-
40
-
41
-
42
-
43
-
44
-
45
-
46
-
47
-
48
-
49
-
50
-
51
-
52
-
53
-
54
-
55
-
56
-
57
-
58
 |
 |

PAGE 24
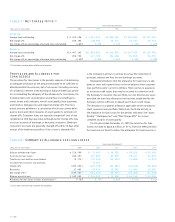
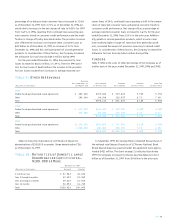
Table 5: Interest Variance Analysis
Year Ended December 31
1997 vs. 1996 1996 vs. 1995
Increase Change Due to(1) Increase Change Due to(1)
(In Thousands) (Decrease) Volume Yield/Rate (Decrease) Volume Yield/Rate
Interest Income:
Consumer loans $(27,697 $ 69,924 $(42,227) $194,434 $106,761 $ 87,673
Federal funds sold and resale agreements (4,870) (5,676) 806 (5,539) (3,297) (2,242)
Other 34,675 36,545 (1,870) 14,179 16,127 (1,948)
Total interest income 57,502 123,085 (65,583) 203,074 117,398 85,676
Interest Expense:
Deposits (14,340) (4,422) (9,918) 6,725 15,788 (9,063)
Other borrowings 10,557 10,947 (390) (37,705) (35,967) (1,738)
Senior and deposit notes 43,631 37,446 6,185 76,583 82,799 (6,216)
Total interest expense 39,848 40,394 (546) 45,603 60,520 (14,917)
Net interest income(1) $(17,654 $ 67,129 $(49,475) $157,471 $ 55,920 $101,551
(1) The change in interest due to both volume and yields/rates has been allocated in proportion to the relationship of the absolute dollar amounts of the change in each.The changes in
income and expense are calculated independently for each line in the table.The totals for the volume and yield/rate columns are not the sum of the individual lines.
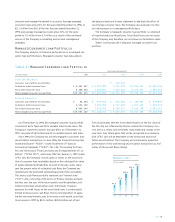
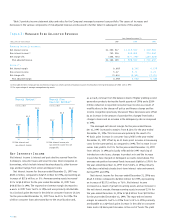
Servicing and Securitizations Income
Servicing and securitizations income in 1997 includes gains on sale
of consumer loans recognized under the provisions of SFAS 125; the
excess of interest and fee income earned over loan losses and inter-
est paid on investor certificates for consumer loan balances securi-
tized prior to January 1, 1997 and other fees earned relating to
securitized loans. In absence of new securitization transactions,
once the entire securitized consumer loan portfolio consists of
transfers measured under SFAS 125, the aggregate gains recog-
nized under SFAS 125 will approximate the excess servicing income
recognized under the accounting method used prior to the imple-
mentation of SFAS 125.The incremental effect in 1997 of imple-
menting SFAS 125 on servicing and securitizations income was
$32.0 million.
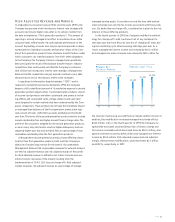
The increase in servicing and securitizations income of $222.5
million, or 48%, to $682.3 million for the year ended December 31,
1997 from $459.8 million for 1996 was due to a number of factors,
including the incremental effect of the implementation of SFAS
125 mentioned above, a 17% increase in average securitized loans
and increases in net interest income and non-interest income, offset
by increased charge-offs on securitized loans. Net interest income
on securitized loans increased $268.1 million, or 41%, for the year
ended December 31, 1997 as compared to the prior year, as a result
of loan growth and an increase in the securitized portfolio’s net
interest margin to 10.29% for the year ended December 31, 1997
from 8.51% for 1996.This increase in net interest margin is the
result of an increase in the yield on securitized loans of 196 basis
points for the year ended December 31, 1997, which was a result of
the securitization of second generation products and an increase in
the amount of past-due fees charged as a result of both a change
in terms and an increase in the delinquency rate on securitized loans
from year to year. Non-interest income on serviced and securitized
loans, excluding the incremental impact of SFAS 125, increased
$199.8 million, or 127%, for the year ended December 31, 1997
from 1996, as a result of loan and account growth, the securitiza-
tion of second generation products and changes in the terms of
overlimit fees charged. Charge-offs of securitized loans for the year
ended December 31, 1997 increased $317.7 million, or 92%, com-
pared to 1996 due to the increase in average securitized loans, con-
tinued seasoning of accounts and general economic trends in
consumer credit performance.
Servicing and securitizations income increased $49.9 million, or
12%, to $459.8 million for the year ended December 31, 1996 from
$409.9 million in 1995, primarily due to increases in net interest
income on securitized credit card loans offset by increased charge-
offs on such loans. Average securitized credit card loans increased
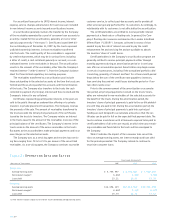
Interest Variance Analysis
Net interest income is affected by changes in the average interest
rate earned on earning assets and the average interest rate paid
on interest-bearing liabilities. In addition, net interest income
is affected by changes in the volume of earning assets and interest-
bearing liabilities.Table 5 sets forth the dollar amount of the
increases (decreases) in interest income and interest expense result-
ing from changes in the volume of earning assets and interest-
bearing liabilities and from changes in yields and rates.