Capital One 1997 Annual Report Download - page 35
Download and view the complete annual report
Please find page 35 of the 1997 Capital One annual report below. You can navigate through the pages in the report by either clicking on the pages listed below, or by using the keyword search tool below to find specific information within the annual report.-
 1
1 -
2
-
3
-
4
-
5
-
6
-
7
-
8
-
9
-
10
-
11
-
12
-
13
-
14
-
15
-
16
-
17
-
18
-
19
-
20
-
21
-
22
-
23
-
24
-
 25
25 -
 26
26 -
 27
27 -
 28
28 -
 29
29 -
 30
30 -
 31
31 -
 32
32 -
 33
33 -
 34
34 -
 35
35 -
 36
36 -
 37
37 -
 38
38 -
 39
39 -
 40
40 -
 41
41 -
 42
42 -
 43
43 -
 44
44 -
 45
45 -
46
-
47
-
48
-
49
-
50
-
51
-
52
-
53
-
54
-
55
-
56
-
57
-
58
 |
 |

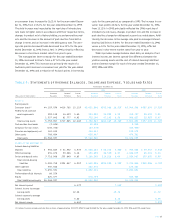
The Company measures exposure to its interest rate risk through
the use of a simulation model.The model generates a distribution of
possible twelve-month managed net interest income outcomes
based on (i) a set of plausible interest rate scenarios, as determined
by management based upon historical trends and market expecta-
tions, (ii) all existing financial instruments, including swaps, and
(iii) an estimate of ongoing business activity over the coming twelve
months.The Company’s asset/liability management policy requires
that based on this distribution there be at least a 95% probability
that managed net interest income achieved over the coming twelve
months will be no more than 4% below the mean managed net
interest income of the distribution. As of December 31, 1997, the
Company was in compliance with the policy; more than 95% of the
outcomes generated by the model produced a managed net interest
income of no more than 3.3% below the mean outcome.The inter-
est rate scenarios evaluated as of December 31, 1997 included
scenarios in which short-term interest rates rose by as much as
450 basis points or fell by as much as 250 basis points over
twelve months.
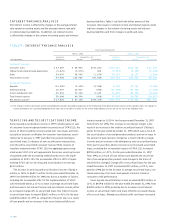
Implementation of this policy represents a change from the
asset/liability management policy in place as of December 31, 1996.
At that time, interest rate sensitivity was assessed on the basis of
the percent change in twelve-month managed net interest income
for an instantaneous and sustained 100 basis point rate shock
applied to an unchanging balance sheet. As of December 31, 1996,
the Company’s policy required that such a rate shock not result in
an adverse change of more than 5% in managed net interest
income; the exposure at the time was 2.1%.
The analysis does not consider the effects of the changed level of
overall economic activity associated with various interest rate sce-
narios. Further, in the event of a rate change of large magnitude,
management would likely take actions to further mitigate its expo-
sure to any adverse impact. For example, management may reprice
interest rates on outstanding credit card loans subject to the right
of the consumers in certain states to reject such repricing by giving
timely written notice to the Company and thereby relinquishing
charging privileges. However, the repricing of credit card loans may
be limited by competitive factors as well as certain legal constraints.
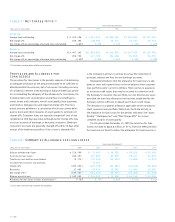
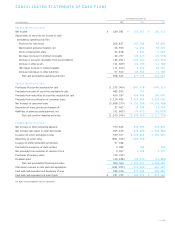
Interest rate sensitivity at a point in time can also be analyzed
by measuring the mismatch in balances of earning assets and inter-
est-bearing liabilities that are subject to repricing in future periods.
Table 12 reflects the interest rate repricing schedule for earning
assets and interest-bearing liabilities as of December 31, 1997.
PAGE 33
Table 12: Interest Rate Sensitivity
As of December 31, 1997 Subject to Repricing
Within >180 Days- >1 Year- Over
(Dollars in Millions) 180 days 1 year 5 Years 5 Years
Earning assets:
Federal funds sold $ 174
Interest-bearing deposits at other banks 59
Securities available for sale 438 $ 150 $ 604 $ 51
Consumer loans 2,454 213 2,195
Total earning assets 3,125 363 2,799 51
Interest-bearing liabilities:
Interest-bearing deposits 962 168 184
Other borrowings 561 235
Senior and other deposit notes 1,025 250 2,018 340
Total interest-bearing liabilities 2,548 653 2,202 340
Non-rate related assets (595)
Interest sensitivity gap 577 (290) 597 (884)
Impact of swaps 640 (215) (425)
Impact of consumer loan securitizations (4,418) 121 4,297
Interest sensitivity gap adjusted for impact of securitizations and swaps $(3,201) $ (169) $ 4,679 $(1,309)
Adjusted gap as a percentage of managed assets (19.48)% (1.03)% 28.47% (7.97)%
Adjusted cumulative gap $(3,201) $(3,370) $ 1,309
Adjusted cumulative gap as a percentage of managed assets (19.48)% (20.51)% 7.97% 0.00)%