Capital One 1997 Annual Report Download - page 28
Download and view the complete annual report
Please find page 28 of the 1997 Capital One annual report below. You can navigate through the pages in the report by either clicking on the pages listed below, or by using the keyword search tool below to find specific information within the annual report.-
 1
1 -
2
-
3
-
4
-
5
-
6
-
7
-
8
-
9
-
10
-
11
-
12
-
13
-
14
-
15
-
16
-
17
-
 18
18 -
 19
19 -
 20
20 -
 21
21 -
 22
22 -
 23
23 -
 24
24 -
 25
25 -
 26
26 -
 27
27 -
 28
28 -
 29
29 -
 30
30 -
 31
31 -
 32
32 -
 33
33 -
 34
34 -
 35
35 -
 36
36 -
 37
37 -
 38
38 -
39
-
40
-
41
-
42
-
43
-
44
-
45
-
46
-
47
-
48
-
49
-
50
-
51
-
52
-
53
-
54
-
55
-
56
-
57
-
58
 |
 |
PAGE 26
The Company could also be affected to the extent that other
entities not affiliated with the Company are impacted by the Year
2000 issue.The Company has initiated formal communications with
its critical third party service providers to determine the extent to
which the Company is vulnerable to those third parties’ failure to
remediate their own Year 2000 issues.There is no guarantee that
these other companies will be successful in addressing their Year
2000 issues.
The Company has incurred expenses throughout 1997 and 1996
related to this project and will continue to incur expenses over the
next year. Costs to modify computer systems have been, and will
continue to be, expensed as incurred and are not expected to have
a material impact on the Company’s future financial results or
condition.
Income Taxes
The Company’s income tax rate was 38% for the year ended
December 31, 1997 as compared to 37.5% for 1996 and includes
both state and federal income tax components.
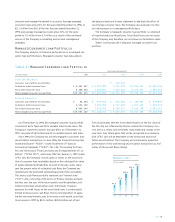
Asset Quality
The asset quality of a portfolio is generally a function of the initial
underwriting criteria used, seasoning of the accounts, levels of com-
petition, account management activities and demographic concen-
tration, as well as general economic conditions.The average age of
the accounts is also an important indicator of the delinquency and
loss levels of the portfolio. Accounts tend to exhibit a rising trend of
delinquency and credit losses as they season. As of December 31,
1997, 53% of managed accounts, representing 43% of the total
managed loan balance, were less than 18 months old. Accordingly, it
is likely that the Company’s managed loan portfolio will experience
increased levels of delinquency and credit losses as the average age
of the Company’s accounts increases.
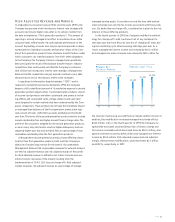
Another factor contributing to the expectation of a rising rate of
delinquency and credit losses is a shift in the product mix. As dis-
cussed in “Risk Adjusted Revenue and Margin,” certain second gen-
eration products have, in some cases, higher delinquency and higher
charge-off rates. In the case of secured card loans, collateral, in the
form of cash deposits, reduces any ultimate charge-offs.The costs
associated with higher delinquency and charge-off rates are consid-
ered in the pricing of individual products.
During 1997, general economic conditions for consumer credit
continued to worsen as industry levels of charge-offs (including
bankruptcies) and delinquencies both increased. These trends have
impacted the Company’s 1997 results.
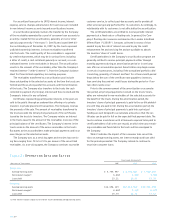
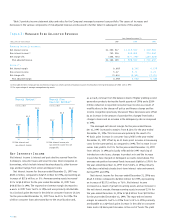
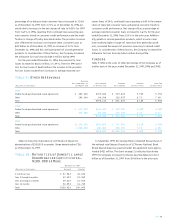
Delinquencies
Table 6 shows the Company’s consumer loan delinquency trends for
the years presented as reported for financial statement purposes
and on a managed basis.The entire balance of an account is con-
tractually delinquent if the minimum payment is not received by the
payment due date. However, the Company generally continues to
accrue interest considered to be collectible until the loan is charged
off. Delinquencies not only have the potential to impact earnings if
the account charges off, they also are costly in terms of the person-
nel and other resources dedicated to resolving the delinquencies.
The 30-plus day delinquency rate for the reported consumer loan
portfolio decreased to 5.51% as of December 31, 1997, from 6.08%
as of December 31, 1996.The decrease in 1997 reported delinquency
reflects the modification in the Company’s methodology for charg-
ing off credit card loans (net of any collateral) to 180 days past-due
from the prior practice of charging off loans during the next billing
cycle after becoming 180 days past-due. In addition, in the fourth
quarter of 1997, the Company recognized the estimated uncol-
lectible portion of finance charge and fee income receivables. As of
December 31, 1997, the reported consumer loan portfolio’s delin-
quency rate without these modifications would have been 6.28%.
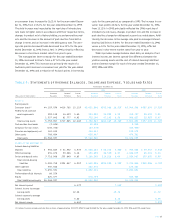
The 30-plus day delinquency rate for the managed consumer
loan portfolio was 6.20% as of December 31, 1997, down from
6.24% as of December 31, 1996, while the dollar amount of delin-
quent managed consumer loans increased approximately $82.9 mil-
lion. As of December 31, 1997, the managed consumer loan portfolio’s
delinquency rate, without the modifications in charge-off policy
and finance charge and fee income recognition, would have been
6.97%.The managed consumer loan portfolio’s delinquency rate as
of December 31, 1997 principally reflected the continued seasoning
of accounts and consumer loan balances, the increased presence
of second generation products, general economic trends in
consumer credit performance and the modifications in charge-off
policy and finance charge and fee income recognition.
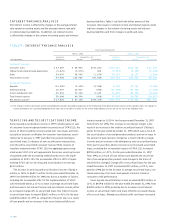
Net Charge-Offs
Net charge-offs include the principal amount of losses (excluding
accrued and unpaid finance charges, fees and fraud losses) less cur-
rent period recoveries. In the fourth quarter of 1997, the Company