Capital One 1997 Annual Report Download - page 25
Download and view the complete annual report
Please find page 25 of the 1997 Capital One annual report below. You can navigate through the pages in the report by either clicking on the pages listed below, or by using the keyword search tool below to find specific information within the annual report.-
 1
1 -
2
-
3
-
4
-
5
-
6
-
7
-
8
-
9
-
10
-
11
-
12
-
13
-
14
-
 15
15 -
 16
16 -
 17
17 -
 18
18 -
 19
19 -
 20
20 -
 21
21 -
 22
22 -
 23
23 -
 24
24 -
 25
25 -
 26
26 -
 27
27 -
 28
28 -
 29
29 -
 30
30 -
 31
31 -
 32
32 -
 33
33 -
 34
34 -
 35
35 -
36
-
37
-
38
-
39
-
40
-
41
-
42
-
43
-
44
-
45
-
46
-
47
-
48
-
49
-
50
-
51
-
52
-
53
-
54
-
55
-
56
-
57
-
58
 |
 |

PAGE 23
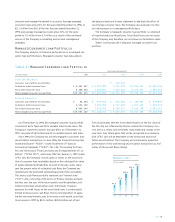
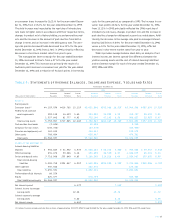
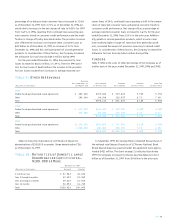
Table 4: Statements of Average Balances, Income and Expense, Yields and Rates
Year Ended December 31
1997 1996 1995
Average Income/ Yield/ Average Income/ Yield/ Average Income/ Yield/
(Dollars in Thousands) Balance Expense Rate Balance Expense Rate Balance Expense Rate
Assets:
Earning assets
Consumer loans(1) $4,103,036 $619,785 15.11% $3,651,908 $592,088 16.21% $2,940,208 $397,654 13.52%
Federal funds sold and
resale agreements 293,119 16,423 5.60 394,939 21,293 5.39 453,797 26,832 5.91
Other 1,357,842 81,777 6.02 752,140 47,102 6.26 508,827 32,923 6.47
Total earning assets 5,753,997 $717,985 12.48% 4,798,987 $660,483 13.76% 3,902,832 $457,409 11.72%
Cash and due from banks (2,636) 40,698 9,309
Allowance for loan losses (132,728) (83,573) (69,939)
Premises and equipment, net 181,610 156,441 123,472
Other assets 768,694 656,407 470,381
Total assets $6,568,937 $5,568,960 $4,436,055
Liabilities and Equity:
Interest-bearing liabilities
Deposits $ 958,885 $ 41,932 4.37% $1,046,122 $ 56,272 5.38% $ 769,688 $ 49,547 6.44%
Other borrowings 631,876 39,066 6.18 454,899 28,509 6.27 1,028,075 66,214 6.44
Senior and deposit notes 3,718,988 253,849 6.83 3,168,205 210,218 6.64 1,924,087 133,635 6.95
Total interest-bearing
liabilities 5,309,749 $334,847 6.31% 4,669,226 $294,999 6.32% 3,721,850 $249,396 6.70%
Other liabilities 345,582 222,975 170,841
Total liabilities 5,655,331 4,892,201 3,892,691
Preferred beneficial interests 89,529
Equity 824,077 676,759 543,364
Total liabilities and equity $6,568,937 $5,568,960 $4,436,055
Net interest spread 6.17% 7.44% 5.02%
Interest income to average
earning assets 12.48 13.76 11.72
Interest expense to average
earning assets 5.82 6.14 6.39
Net interest margin 6.66% 7.62% 5.33%
(1) Interest income includes past-due fees on loans of approximately $132,297, $94,393 and $50,384 for the years ended December 31, 1997, 1996 and 1995, respectively.
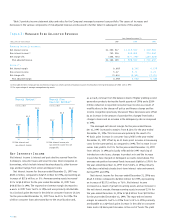
on consumer loans increased to 16.21% for the year ended Decem-
ber 31, 1996 from 13.52% for the year ended December 31, 1995.
The yield increase was impacted by the repricing of introductory
rate loans to higher rates in accordance with their respective terms,
changes in product mix to higher yielding, second generation prod-
ucts and the increase in the amount of past-due fees from both a
change in terms and an increase in the delinquency rate.The aver-
age rate paid on borrowed funds decreased to 6.32% for the year
ended December 31, 1996 from 6.70% in 1995 primarily reflecting
decreases in short-term market rates from year to year.
The managed net interest margin for the year ended December
31, 1996 increased to 8.16% from 6.27% for the year ended
December 31, 1995.This increase was primarily the result of a
164 basis point increase in consumer loan yield for the year ended
December 31, 1996 and a reduction of 46 basis points in borrowing
costs for the same period, as compared to 1995.The increase in con-
sumer loan yield to 14.76% for the year ended December 31, 1996
from 13.12% in 1995 principally reflected the 1996 repricing of
introductory rate loans, changes in product mix and the increase in
past-due fees charged on delinquent accounts as noted above. Addi-
tionally, the decrease in the average rate paid on managed interest-
bearing liabilities to 5.84% for the year ended December 31, 1996
versus 6.30% for the year ended December 31, 1995, reflected
decreases in short-term market rates from year to year.
Table 4 provides average balance sheet data, an analysis of net
interest income, net interest spread (the difference between the
yield on earning assets and the cost of interest-bearing liabilities)
and net interest margin for each of the years ended December 31,
1997, 1996 and 1995.