BP 2011 Annual Report Download - page 96
Download and view the complete annual report
Please find page 96 of the 2011 BP annual report below. You can navigate through the pages in the report by either clicking on the pages listed below, or by using the keyword search tool below to find specific information within the annual report.-
 1
1 -
2
-
3
-
4
-
5
-
6
-
7
-
8
-
9
-
10
-
11
-
12
-
13
-
14
-
15
-
16
-
17
-
18
-
19
-
20
-
21
-
22
-
23
-
24
-
25
-
26
-
27
-
28
-
29
-
30
-
31
-
32
-
33
-
34
-
35
-
36
-
37
-
38
-
39
-
40
-
41
-
42
-
43
-
44
-
45
-
46
-
47
-
48
-
49
-
50
-
51
-
52
-
53
-
54
-
55
-
56
-
57
-
58
-
59
-
60
-
61
-
62
-
63
-
64
-
65
-
66
-
67
-
68
-
69
-
70
-
71
-
72
-
73
-
74
-
75
-
76
-
77
-
78
-
79
-
80
-
81
-
82
-
83
-
84
-
85
-
 86
86 -
 87
87 -
 88
88 -
 89
89 -
 90
90 -
 91
91 -
 92
92 -
 93
93 -
 94
94 -
 95
95 -
 96
96 -
 97
97 -
 98
98 -
 99
99 -
 100
100 -
 101
101 -
 102
102 -
 103
103 -
 104
104 -
 105
105 -
 106
106 -
107
-
108
-
109
-
110
-
111
-
112
-
113
-
114
-
115
-
116
-
117
-
118
-
119
-
120
-
121
-
122
-
123
-
124
-
125
-
126
-
127
-
128
-
129
-
130
-
131
-
132
-
133
-
134
-
135
-
136
-
137
-
138
-
139
-
140
-
141
-
142
-
143
-
144
-
145
-
146
-
147
-
148
-
149
-
150
-
151
-
152
-
153
-
154
-
155
-
156
-
157
-
158
-
159
-
160
-
161
-
162
-
163
-
164
-
165
-
166
-
167
-
168
-
169
-
170
-
171
-
172
-
173
-
174
-
175
-
176
-
177
-
178
-
179
-
180
-
181
-
182
-
183
-
184
-
185
-
186
-
187
-
188
-
189
-
190
-
191
-
192
-
193
-
194
-
195
-
196
-
197
-
198
-
199
-
200
-
201
-
202
-
203
-
204
-
205
-
206
-
207
-
208
-
209
-
210
-
211
-
212
-
213
-
214
-
215
-
216
-
217
-
218
-
219
-
220
-
221
-
222
-
223
-
224
-
225
-
226
-
227
-
228
-
229
-
230
-
231
-
232
-
233
-
234
-
235
-
236
-
237
-
238
-
239
-
240
-
241
-
242
-
243
-
244
-
245
-
246
-
247
-
248
-
249
-
250
-
251
-
252
-
253
-
254
-
255
-
256
-
257
-
258
-
259
-
260
-
261
-
262
-
263
-
264
-
265
-
266
-
267
-
268
-
269
-
270
-
271
-
272
-
273
-
274
-
275
-
276
-
277
-
278
-
279
-
280
-
281
-
282
-
283
-
284
-
285
-
286
-
287
-
288
-
289
-
290
-
291
-
292
-
293
-
294
-
295
-
296
-
297
-
298
-
299
-
300
 |
 |

94 BP Annual Report and Form 20-F 2011
Business review
Refining and Marketing
Our Refining and Marketing segment is responsible for the refining,
manufacturing, marketing, transportation, and supply and trading of crude
oil, petroleum, petrochemicals products and related services to wholesale
and retail customers. We have significant operations in Europe, North
America and Asia, and we also manufacture and market our products
across Australasia, southern Africa and Central and South America; in total
we market our products in more than 70 countries.
The segment operates hydrocarbon value chains covering three
main businesses: fuels, lubricants and petrochemicals. Previously we
referred to lubricants and petrochemicals as international businesses, but
to provide greater transparency of the performance of these businesses
we are now providing our financial information separately for fuels,
lubricants and petrochemicals.
The fuels businesses sell refined petroleum products including
gasoline, diesel, aviation fuel and liquefied petroleum gas (LPG). Within
this, the fuels value chains (FVCs) integrate the activities of refining,
logistics, marketing, and supply and trading on a regional basis. This
recognizes the geographic nature of the markets in which we compete,
providing the opportunity to optimize our activities from crude oil purchases
to end-consumer sales through our physical assets (refineries, terminals,
pipelines and retail stations). In addition, we operate a global aviation fuels
marketing business and an LPG marketing business.
Our lubricants business is involved in manufacturing and marketing
lubricants and related services to markets around the world. We market
lubricants to the automotive, industrial, marine, aviation and energy
markets through our key brands of Castrol, BP and Aral. Our Castrol brand
is a highly recognized and popular lubricant brand worldwide. Distinctive
brands, cutting-edge technology and building and sustaining customer
relationships are cornerstones to our approach to market and underpin our
success. We are particularly strong in Europe and key Asia Pacific markets
including India.
Our petrochemicals business operates on a global basis and
includes the manufacture and marketing of petrochemicals that are
used in many everyday products, such as plastic bottles and textiles for
clothing. Technology is at the heart of our business and we own proprietary
world class technology for each of our main products. Our technological
advantage, operational experience and project execution track record
has made us an attractive partner which leads to material and distinctive
growth opportunities. Petrochemicals growth is focused on the demand
centre of Asia.
Our market
Overall world economic growth slowed in 2011, as did growth in world
oil consumption. Global oil demand grew by 0.7 million b/d, but in the
OECD, demand contracted again after growing for the first time in five
years in 2010. By contrast, there was demand growth in Australia and
Japan, where oil partially replaced nuclear power after the earthquake and
tsunami. Aggregate OECD oil demand in 2011 was 4.3 million b/d below
the 2005 peak.
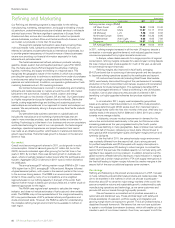
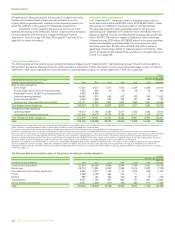
The annual average BP refining marker margin (RMM) in 2011 was
16% higher than in 2010, averaging $11.64 per barrel. Margins followed
a typical seasonal pattern, with a peak in the second quarter in the run-up
to the summer driving season. The RMM is an environmental indicator,
similar to those used by many of our competitors, and is weighted
regionally based on our refining capacity in that part of the world. Each
regional marker margin is based upon product yields and a marker crude oil
deemed appropriate for the region.
The RMM uses regional crack spreads to calculate the margin
indicator, and does not include estimates of fuel costs and other variable
costs. The RMMs may not be representative of the margins achieved by
BP in any period because of BP’s particular refinery configurations and
crude and product slate. However, the RMM is useful for understanding
the indicative refining margin environment that is available to refiners in
each region.
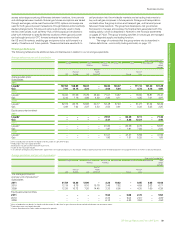
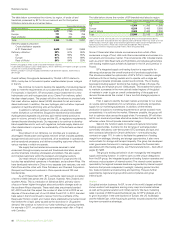
$ per barrel
Crude marker 2011 2010 2009
Refining marker margin (RMM)
US West Coast ANS 13.63 13.09 13.40
US Gulf Coast Mars 11.87 10.17 9.16
US Midwest LLS 7.46 6.00 6.02
Northwest Europe Brent 11.85 10.36 8.95
Mediterranean Azeri Light 9.03 8.82 7.93
Singapore Dubai/Tapis blend 14.57 10.69 8.51
BP Average RMM 11.64 10.02 9.19
In 2011, refining margins increased in all the main US regions, despite a
contraction in domestic gasoline demand, with reduced gasoline import
volumes compensated for by higher domestic crude runs.
In Europe, where diesel accounts for a large proportion of regional
consumption, refining margins increased for a second year running despite
the loss of Libyan sweet crude supplies for much of the year, as demand
for commercial transport improved.
Refining margins also improved in Asia Pacific, averaging
$14.57 per barrel due to continuing oil demand growth and the disruption
to Japanese refining operations caused by the earthquake and tsunami.
US mid-continent crude oils (including West Texas Intermediate
(WTI)) were heavily discounted throughout the year because of increasing
production in the US mid-continent and Canada, coupled with constrained
infrastructure for crude transportation. This particularly benefited BP’s
location-advantaged refineries of Toledo and Whiting in the US Midwest.
In addition, fuel oil price discounts versus crude oil widened in 2011,
benefiting our highly upgraded refineries that produce relatively little
fuel oil.
In oil markets in 2011, supply was hampered by geo-political
issues and a series of technical problems in non-OPEC crude production.
This supply deficit brought OECD stocks down from historical highs to
near-average levels within the first nine months of the year. After very low
volatility levels in the second half of 2009 and in 2010, 2011 saw a return
towards more average volatility.
In lubricants, we saw modest improvement in demand for the
automotive and industrial sectors early in the year, but this came under
increasing pressure as the year progressed and by the fourth quarter
demand was declining in many geographies. Base oil prices rose markedly
in the first half of the year, increasing our input costs. We continued to
see a gradual shift towards higher-quality and higher-margin premium and
synthetic lubricants.
In the first half of 2011, the petrochemicals margin environment
was markedly different from the second half, due to strong demand
for purified terephthalic acid (PTA) coupled with supply interruptions in
both PTA and paraxylene (PX) leading to robust margins. In contrast the
second half of the year saw the installed capacity run normally along with
significant new capacity coming onstream. In addition concerns over the
global economy affected demand, leading to a rapid reduction in margins.
Acetic acid had a similar margin profile to PTA with supply interruptions in
the first half leading to higher margins followed by weaker margins in the
second half of the year as additional capacity came onstream.
Our strategy
Refining and Marketing is the product and service-led arm of BP, focused
on fuels, lubricants and petrochemicals products and related services. We
aim to be excellent in the markets in which we choose to participate –
those that allow BP to serve the major energy markets of the world. We
pursue competitive returns and sustainable growth, underpinned by safe
manufacturing operations and technology, as we serve customers and
promote BP and our brands through high-quality products.
We are focused on a consistent set of priorities executed in a
systematic and disciplined way. These priorities begin with safety and
include excellence of execution, portfolio quality and integration and
growing margin share via exposure to growth. This is all underpinned by a
disciplined financial framework. We believe that we now have a platform
to sustain a world-class downstream business, which will enable us to be
a leader in each of our chosen markets. Over time, we expect to shift the