BP 2011 Annual Report Download - page 82
Download and view the complete annual report
Please find page 82 of the 2011 BP annual report below. You can navigate through the pages in the report by either clicking on the pages listed below, or by using the keyword search tool below to find specific information within the annual report.-
 1
1 -
2
-
3
-
4
-
5
-
6
-
7
-
8
-
9
-
10
-
11
-
12
-
13
-
14
-
15
-
16
-
17
-
18
-
19
-
20
-
21
-
22
-
23
-
24
-
25
-
26
-
27
-
28
-
29
-
30
-
31
-
32
-
33
-
34
-
35
-
36
-
37
-
38
-
39
-
40
-
41
-
42
-
43
-
44
-
45
-
46
-
47
-
48
-
49
-
50
-
51
-
52
-
53
-
54
-
55
-
56
-
57
-
58
-
59
-
60
-
61
-
62
-
63
-
64
-
65
-
66
-
67
-
68
-
69
-
70
-
71
-
 72
72 -
 73
73 -
 74
74 -
 75
75 -
 76
76 -
 77
77 -
 78
78 -
 79
79 -
 80
80 -
 81
81 -
 82
82 -
 83
83 -
 84
84 -
 85
85 -
 86
86 -
 87
87 -
 88
88 -
 89
89 -
 90
90 -
 91
91 -
 92
92 -
93
-
94
-
95
-
96
-
97
-
98
-
99
-
100
-
101
-
102
-
103
-
104
-
105
-
106
-
107
-
108
-
109
-
110
-
111
-
112
-
113
-
114
-
115
-
116
-
117
-
118
-
119
-
120
-
121
-
122
-
123
-
124
-
125
-
126
-
127
-
128
-
129
-
130
-
131
-
132
-
133
-
134
-
135
-
136
-
137
-
138
-
139
-
140
-
141
-
142
-
143
-
144
-
145
-
146
-
147
-
148
-
149
-
150
-
151
-
152
-
153
-
154
-
155
-
156
-
157
-
158
-
159
-
160
-
161
-
162
-
163
-
164
-
165
-
166
-
167
-
168
-
169
-
170
-
171
-
172
-
173
-
174
-
175
-
176
-
177
-
178
-
179
-
180
-
181
-
182
-
183
-
184
-
185
-
186
-
187
-
188
-
189
-
190
-
191
-
192
-
193
-
194
-
195
-
196
-
197
-
198
-
199
-
200
-
201
-
202
-
203
-
204
-
205
-
206
-
207
-
208
-
209
-
210
-
211
-
212
-
213
-
214
-
215
-
216
-
217
-
218
-
219
-
220
-
221
-
222
-
223
-
224
-
225
-
226
-
227
-
228
-
229
-
230
-
231
-
232
-
233
-
234
-
235
-
236
-
237
-
238
-
239
-
240
-
241
-
242
-
243
-
244
-
245
-
246
-
247
-
248
-
249
-
250
-
251
-
252
-
253
-
254
-
255
-
256
-
257
-
258
-
259
-
260
-
261
-
262
-
263
-
264
-
265
-
266
-
267
-
268
-
269
-
270
-
271
-
272
-
273
-
274
-
275
-
276
-
277
-
278
-
279
-
280
-
281
-
282
-
283
-
284
-
285
-
286
-
287
-
288
-
289
-
290
-
291
-
292
-
293
-
294
-
295
-
296
-
297
-
298
-
299
-
300
 |
 |

80 BP Annual Report and Form 20-F 2011
Business review
Exploration and Production
At the end of 2010, as part of our response to the Deepwater Horizon
oil spill, we announced the decision to reorganize the Exploration and
Production segment to create three separate divisions: Exploration,
Developments and Production, integrated through a Strategy and
Integration organization. This structure was established in March 2011
and each of the four parts is led by an executive vice president reporting
directly to the group chief executive. The new organization is designed
to change the way we operate, with a particular focus on managing
risk, delivering common standards and processes and building technical
capability. The new organization has not changed the way we report our
operating segments under IFRS.
The Exploration division is accountable for renewing our resource
base through access, exploration and appraisal. The Developments
division is accountable for the safe and compliant execution of wells
(drilling and completions) and major projects and comprises the global
wells organization and the global projects organization, which were
established in 2011. The Production division is accountable for safe and
compliant operations, including upstream production assets, midstream
transportation and processing activities, and the development of our
resource base. Divisional activities are integrated on a regional basis by a
regional president reporting to the Production division. The Strategy and
Integration organization is accountable for optimization and integration
across the divisions, including the delivery of support from the group’s
finance, procurement and supply chain, human resources, technology and
information technology functions.
From 1 January 2012, the group’s investment in TNK-BP will
be reported as a separate operating segment, rather than within the
Exploration and Production segment, reflecting the way in which the
investment is now managed.
The group safety and operational risk (S&OR) function maintains
our global safety standards. S&OR staff are deployed at the operating level
within the Exploration and Production segment to support the systematic
and disciplined application of those standards. This creates an independent
reporting line, working alongside line management while having the power
to intervene.
Our Exploration and Production segment included upstream
and midstream activities in 30 countries in 2011, including Angola,
Azerbaijan, Brazil, Canada, Egypt, India, Iraq, Norway, Russia, Trinidad &
Tobago (Trinidad), the UK, the US and other locations within Africa, Asia,
Australasia and South America, as well as gas marketing and trading
activities, primarily in Canada, Europe and the US. Upstream activities
involve oil and natural gas exploration, field development and production.
Our exploration and appraisal programme is currently focused on Angola,
Australia, Azerbaijan, Brazil, Canada, Egypt, the deepwater Gulf of Mexico,
the UK North Sea, Oman and onshore US. Major development areas
include Angola, Australia, Azerbaijan, Canada, Egypt, the deepwater Gulf of
Mexico, North Africa, and the UK North Sea. During 2011, production came
from 24 countries. The principal areas of production are Angola, Argentina,
Azerbaijan, Egypt, Russia, Trinidad, the UAE, the UK and the US.
Midstream activities involve the ownership and management
of crude oil and natural gas pipelines, processing facilities and export
terminals, LNG processing facilities and transportation, and our NGL
extraction businesses in Canada, Indonesia, the US and the UK. Our most
significant midstream pipeline interests are the Trans-Alaska Pipeline
System in the US; the Forties Pipeline System and the Central Area
Transmission System pipeline, both in the UK sector of the North Sea;
the South Caucasus Pipeline, which runs from Azerbaijan through Georgia
to the Turkish border; and the Baku-Tbilisi-Ceyhan pipeline, which runs
through Azerbaijan, Georgia and Turkey. Major LNG activities are located in
Australia, Indonesia and Trinidad. BP is also investing in the LNG business
in Angola.
Additionally, our activities include the marketing and trading of natural gas,
power and natural gas liquids. These activities provide routes into liquid
markets for BP’s produced gas, and generate margins and fees associated
with the provision of physical products and derivatives to third parties and
income from asset optimization and trading.
Our oil and natural gas production assets are located onshore and
offshore and include wells, gathering centres, in-field flow lines, processing
facilities, storage facilities, offshore platforms, export systems (e.g. transit
lines), pipelines and LNG plant facilities.
Upstream operations in Abu Dhabi, Argentina, Bolivia, Chile, Russia,
Venezuela and Vietnam as well as some of our operations in Angola,
Canada, Indonesia and Trinidad are conducted through equity-accounted
entities.
Our market
Energy demand, and in particular oil demand, has followed overall
economic trends in recent years, recovering strongly in 2010 but facing
more challenging conditions in 2011.
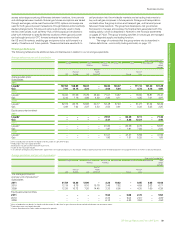
Dated Brent for the year averaged $111.26 per barrel, 40%
above 2010’s average of $79.50 per barrel. In 2012, we expect oil price
movements to continue to be driven by the pace of global economic
growth and its resulting implications for oil consumption, and by OPEC
production decisions.
Natural gas prices diverged globally in 2011, reflecting different
regional dynamics. The average US Henry Hub First of Month Index fell
to $4.04/mmBtu, an 8% decrease from 2010, while in Europe prices
increased. Spot gas prices at the UK National Balancing Point increased by
33% to an average of $56.33 pence per therm for 2011.
After a record increase in 2010, global gas consumption growth
moderated in 2011. In the US, economic momentum supported gas use
in the first half of the year and a hot summer raised demand. Yet domestic
production outpaced consumption growth due to further increases in the
availability of shale gas.
In 2012, we expect gas markets to continue to be driven by the
economy, weather, domestic production, LNG supply and reductions in
nuclear power generation following the Fukushima disaster in Japan in
March 2011.
Our strategy
In Exploration and Production, our highest priority is to ensure safe, reliable
and compliant operations worldwide. Our strategy is to invest to grow long-
term value by continuing to build a portfolio of material, enduring positions
in the world’s key hydrocarbon basins with a focus on deepwater, gas
value chains and giant fields. Our strategy is enabled by:
• A continued focus on safety and managing risk.
• Strong relationships built on mutual advantage, deep knowledge of the
basins in which we operate, and technology.
• Building capability along the value chain in Exploration, Developments
and Production.
• Actively managing our portfolio.
We intend to increase investment with a focus on Exploration, a key
source of value creation, and evolve the nature of our relationships,
particularly with national oil companies.