BP 2011 Annual Report Download - page 148
Download and view the complete annual report
Please find page 148 of the 2011 BP annual report below. You can navigate through the pages in the report by either clicking on the pages listed below, or by using the keyword search tool below to find specific information within the annual report.-
 1
1 -
2
-
3
-
4
-
5
-
6
-
7
-
8
-
9
-
10
-
11
-
12
-
13
-
14
-
15
-
16
-
17
-
18
-
19
-
20
-
21
-
22
-
23
-
24
-
25
-
26
-
27
-
28
-
29
-
30
-
31
-
32
-
33
-
34
-
35
-
36
-
37
-
38
-
39
-
40
-
41
-
42
-
43
-
44
-
45
-
46
-
47
-
48
-
49
-
50
-
51
-
52
-
53
-
54
-
55
-
56
-
57
-
58
-
59
-
60
-
61
-
62
-
63
-
64
-
65
-
66
-
67
-
68
-
69
-
70
-
71
-
72
-
73
-
74
-
75
-
76
-
77
-
78
-
79
-
80
-
81
-
82
-
83
-
84
-
85
-
86
-
87
-
88
-
89
-
90
-
91
-
92
-
93
-
94
-
95
-
96
-
97
-
98
-
99
-
100
-
101
-
102
-
103
-
104
-
105
-
106
-
107
-
108
-
109
-
110
-
111
-
112
-
113
-
114
-
115
-
116
-
117
-
118
-
119
-
120
-
121
-
122
-
123
-
124
-
125
-
126
-
127
-
128
-
129
-
130
-
131
-
132
-
133
-
134
-
135
-
136
-
137
-
 138
138 -
 139
139 -
 140
140 -
 141
141 -
 142
142 -
 143
143 -
 144
144 -
 145
145 -
 146
146 -
 147
147 -
 148
148 -
 149
149 -
 150
150 -
 151
151 -
 152
152 -
 153
153 -
 154
154 -
 155
155 -
 156
156 -
 157
157 -
 158
158 -
159
-
160
-
161
-
162
-
163
-
164
-
165
-
166
-
167
-
168
-
169
-
170
-
171
-
172
-
173
-
174
-
175
-
176
-
177
-
178
-
179
-
180
-
181
-
182
-
183
-
184
-
185
-
186
-
187
-
188
-
189
-
190
-
191
-
192
-
193
-
194
-
195
-
196
-
197
-
198
-
199
-
200
-
201
-
202
-
203
-
204
-
205
-
206
-
207
-
208
-
209
-
210
-
211
-
212
-
213
-
214
-
215
-
216
-
217
-
218
-
219
-
220
-
221
-
222
-
223
-
224
-
225
-
226
-
227
-
228
-
229
-
230
-
231
-
232
-
233
-
234
-
235
-
236
-
237
-
238
-
239
-
240
-
241
-
242
-
243
-
244
-
245
-
246
-
247
-
248
-
249
-
250
-
251
-
252
-
253
-
254
-
255
-
256
-
257
-
258
-
259
-
260
-
261
-
262
-
263
-
264
-
265
-
266
-
267
-
268
-
269
-
270
-
271
-
272
-
273
-
274
-
275
-
276
-
277
-
278
-
279
-
280
-
281
-
282
-
283
-
284
-
285
-
286
-
287
-
288
-
289
-
290
-
291
-
292
-
293
-
294
-
295
-
296
-
297
-
298
-
299
-
300
 |
 |

Directors’ remuneration report
146 BP Annual Report and Form 20-F 2011
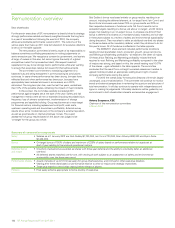
Remuneration policy for 2012 in more depth
This section contains a more detailed explanation of the components of
total remuneration for executive directors and how they will be
implemented in 2012.
Salary
The committee normally reviews salaries annually, taking into account
other large Europe-based global companies, other oil majors, and relevant
US companies. It also considers salary treatment throughout the company
when determining appropriate increases for executive directors.
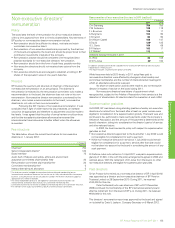
Annual bonus
The group strategy provides the context for the company’s annual plan,
from which measures and targets are derived at the start of the year for
senior managers including executive directors. Measures typically include
a range of financial and operating metrics as well as those relating to
safety and environment, and people.
At the end of each year, performance is assessed relative to the
measures and targets established at the start of the year, adjusted for any
material changes in the market environment (predominantly oil prices).
Assessment includes both quantitative and qualitative views as well as
input from the other committees on relevant aspects. The committee
considers that this informed judgement is important to establishing a fair
overall assessment.
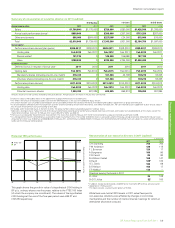
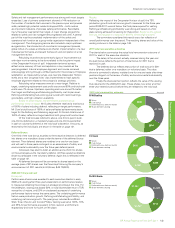
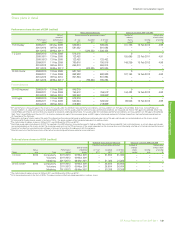
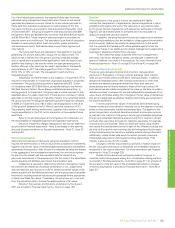
The chart below shows the average annual bonus result (before
any deferral) and relative to an on-target level for executive directors for
the current year and previous five.
200
150
100
50
History of annual bonus results
20072006 2008 200
92
0112010
on-target
average actual result
% of target
For 2012, all executive directors will again be eligible for a total bonus
(including deferral) of 150% of salary at target and 225% at maximum.
Mr Dudley’s bonus will be based entirely on group measures. Mr Conn,
Dr Gilvary and Dr Grote will have 70% of their bonus based on group
results and 30% on their respective segment or function.
The measures used to determine bonus results flow directly from
the group’s annual plan which reflects the strategic priorities of reinforcing
safety and risk management, rebuilding trust, and reinforcing value
creation.
At group level, safety and risk management measures include
recordable injury frequency, loss of primary containment and process
related major incident announcements and high potential incidents.
Rebuilding trust will be measured via surveys to assess both external
reputation and internal staff alignment and morale. Restoring value will
provide the dominant set of measures and include operating cash flow,
underlying replacement cost profit, total cash costs, gearing, divestments,
upstream production efficiency, major project delivery and Refining and
Marketing profitability.
The Refining and Marketing segment will include specific safety
metrics for the segment. Value metrics will include availability, efficiency,
and profitability metrics, as well as divestments and major project
delivery. Finance function measures will include divestments, gearing
and major project delivery. The corporate business function will include
profitability and compliance measures for IST and Alternative Energy.
In all cases, targets for each measure are set so that achieving plan
levels of performance equates to an on-target bonus. As in past years,
in addition to the specific bonus metrics, the committee will also review
the underlying performance of the group in light of competitors’ results,
analysts’ reports and the views of the chairmen of the other committees.
Based on this broader view, the committee can decide to adjust bonuses
where it is warranted and, in exceptional circumstances, to pay no
bonuses.
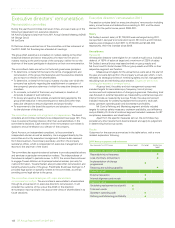
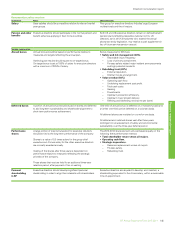
Deferred bonus
The structure of deferred bonus, paid in shares, places increased focus
on long-term alignment with shareholders, and reinforces the critical
importance of maintaining high safety and environmental standards. It
effectively translates the outcome of a portion of the annual performance
bonus into a long-term plan with additional performance hurdles. As
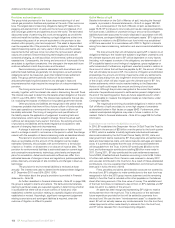
shown below, the results of 2012 will form the basis for determining the
deferred bonus in 2013.
Timeline for 2012 deferred bonus
2013 20142012 2015 2016
DeferralDeferral
Result of
annual
performance
Result of
annual
performance Vesting
Vesting
Performance period
For 2012, as last year, one-third of the annual bonus will be deferred
into shares for three years and matched by the company on a one-for-
one basis. Under the rules of the plan, the average share price over
the three days following announcement of full-year results is used to
determine the number of shares. Both deferred and matched shares
will vest in February 2016 contingent on an assessment of safety and
environmental sustainability over the three-year deferral period. If the
committee assesses that there has been a material deterioration in safety
and environmental metrics, or there have been major incidents revealing
underlying weaknesses in safety and environmental management, then it
may conclude that shares should vest in part, or not at all. In reaching its
conclusion, the committee will obtain advice from the safety, ethics and
environment assurance committee (SEEAC).
Executive directors may voluntarily defer a further one-third of their
annual bonus into shares, which will be capable of vesting, and will qualify
for matching, on the same basis as set out above. Where shares vest,
the executive director will also receive additional shares representing the
value of the re-invested dividends.
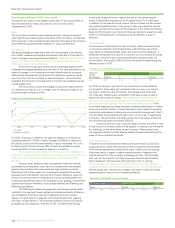
Performance shares
The performance share element reflects the committee’s policy that a
large proportion of total remuneration is tied to long-term performance.
Performance shares are awarded at the start of each year and vesting,
after three years, is based on performance relative to measures and
targets derived from the company’s strategic priorities. Those shares
that vest are then held for a further three-year retention period before
being released to the executive after payment of tax on vesting.
This gives executive directors a six-year incentive structure, which is
designed to ensure their interests are aligned with those of shareholders.
Where shares vest, the executive director will receive additional shares
representing the value of the re-invested dividends.
Timeline for 2012-2014 share element
2012 2013 2014 2015 2016 2017 2018
AwardAward VestingVesting ReleaseRelease
Retention periodPerformance period