BP 2011 Annual Report Download - page 145
Download and view the complete annual report
Please find page 145 of the 2011 BP annual report below. You can navigate through the pages in the report by either clicking on the pages listed below, or by using the keyword search tool below to find specific information within the annual report.-
 1
1 -
2
-
3
-
4
-
5
-
6
-
7
-
8
-
9
-
10
-
11
-
12
-
13
-
14
-
15
-
16
-
17
-
18
-
19
-
20
-
21
-
22
-
23
-
24
-
25
-
26
-
27
-
28
-
29
-
30
-
31
-
32
-
33
-
34
-
35
-
36
-
37
-
38
-
39
-
40
-
41
-
42
-
43
-
44
-
45
-
46
-
47
-
48
-
49
-
50
-
51
-
52
-
53
-
54
-
55
-
56
-
57
-
58
-
59
-
60
-
61
-
62
-
63
-
64
-
65
-
66
-
67
-
68
-
69
-
70
-
71
-
72
-
73
-
74
-
75
-
76
-
77
-
78
-
79
-
80
-
81
-
82
-
83
-
84
-
85
-
86
-
87
-
88
-
89
-
90
-
91
-
92
-
93
-
94
-
95
-
96
-
97
-
98
-
99
-
100
-
101
-
102
-
103
-
104
-
105
-
106
-
107
-
108
-
109
-
110
-
111
-
112
-
113
-
114
-
115
-
116
-
117
-
118
-
119
-
120
-
121
-
122
-
123
-
124
-
125
-
126
-
127
-
128
-
129
-
130
-
131
-
132
-
133
-
134
-
 135
135 -
 136
136 -
 137
137 -
 138
138 -
 139
139 -
 140
140 -
 141
141 -
 142
142 -
 143
143 -
 144
144 -
 145
145 -
 146
146 -
 147
147 -
 148
148 -
 149
149 -
 150
150 -
 151
151 -
 152
152 -
 153
153 -
 154
154 -
 155
155 -
156
-
157
-
158
-
159
-
160
-
161
-
162
-
163
-
164
-
165
-
166
-
167
-
168
-
169
-
170
-
171
-
172
-
173
-
174
-
175
-
176
-
177
-
178
-
179
-
180
-
181
-
182
-
183
-
184
-
185
-
186
-
187
-
188
-
189
-
190
-
191
-
192
-
193
-
194
-
195
-
196
-
197
-
198
-
199
-
200
-
201
-
202
-
203
-
204
-
205
-
206
-
207
-
208
-
209
-
210
-
211
-
212
-
213
-
214
-
215
-
216
-
217
-
218
-
219
-
220
-
221
-
222
-
223
-
224
-
225
-
226
-
227
-
228
-
229
-
230
-
231
-
232
-
233
-
234
-
235
-
236
-
237
-
238
-
239
-
240
-
241
-
242
-
243
-
244
-
245
-
246
-
247
-
248
-
249
-
250
-
251
-
252
-
253
-
254
-
255
-
256
-
257
-
258
-
259
-
260
-
261
-
262
-
263
-
264
-
265
-
266
-
267
-
268
-
269
-
270
-
271
-
272
-
273
-
274
-
275
-
276
-
277
-
278
-
279
-
280
-
281
-
282
-
283
-
284
-
285
-
286
-
287
-
288
-
289
-
290
-
291
-
292
-
293
-
294
-
295
-
296
-
297
-
298
-
299
-
300
 |
 |

Directors’ remuneration report
Directors’ remuneration report
BP Annual Report and Form 20-F 2011 143
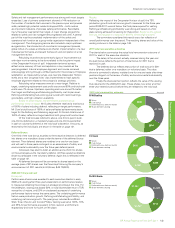
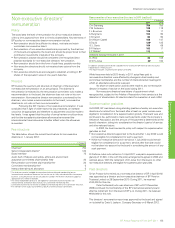
Safety and risk management performance was strong with most targets
exceeded. Loss of primary containment showed a 14% reduction on
the number of incidents that occurred in the previous year and process
safety related high potential incidents dropped 26% – both metrics
are important indicators of process safety performance. Recordable
injury frequency was better than target. A major change programme
related to safety and risk management progressed very well. A central
part of this was the completed implementation of the safety and
operational risk function as a group-wide organization independent of line
management. The change programme also included a major upstream
reorganization, the introduction of a contractor management process,
global rollout of a values and behaviours charter, implementation of a new
individual performance and reward framework and completion of a risk
management review.
Rebuilding trust showed some early signs of improvement but
with clear work remaining to be done related to the long-term impact
of the Deepwater Horizon oil spill. Independent external surveys
reflect some recovery of trust and reputation in key markets as the
year progressed. Internal employee alignment and morale remained
encouragingly strong through a difficult period for the company. Employee
satisfaction, as measured by survey, was near pre-Deepwater Horizon
levels and a new ‘progress index’ was implemented to track specific
employee alignment related to the company’s strategic priorities.
Rebuilding value measures were at or near target. Relative to
target, underlying replacement cost profit was around 90% and total cash
costs were 7% above. Upstream operating cash was some 3% better
than target and Refining and Marketing profitability met its plan level.
Refining and Marketing had a strong year overall with record earnings,
good safety, and high utilization availability.
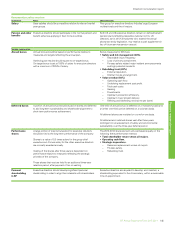
Based on these results, the committee assessed group
performance to be on-target. Mr Dudley therefore received a total bonus
of 150% of salary including deferral, reflecting on-target performance.
Mr Conn’s total bonus of 165% of salary reflected achievements above
target for the Refining and Marketing segment. Dr Grote’s total bonus of
150% of salary reflects on-target results at both group and function level.
Of the total bonuses referred to above, one-third is paid in cash,
one-third is deferred on a mandatory basis and one-third is paid either
in cash or voluntarily deferred at the individual’s discretion. Amounts, as
received by the individuals, are shown in the table on page 141.
Deferred bonus
One-third of the total bonus awarded to the executive directors is deferred
into shares on a mandatory basis under the terms of the deferred bonus
element. Their deferred shares are matched on a one-for-one basis
and will vest in three years contingent on an assessment of safety and
environmental sustainability over the three-year deferral period.
Individuals may elect to defer an additional one-third into shares
on the same basis as the mandatory deferral. All three executive directors
chose to participate in the voluntary deferral. Again this is reflected in the
table on page 141.
All deferred bonuses will be converted to shares based on the
average price of BP shares over the three days following the company’s
announcement of 2011 results (£4.91/share, $46.70/ADS).
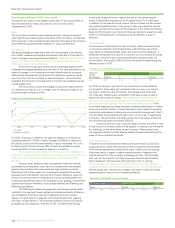
2009-2011 share element
Framework
Performance shares were awarded to each executive director in early
2009 with vesting after three years dependent on performance relative
to measures reflecting the company’s strategic priorities at the time. For
the 2009 plan, vesting was based 50% on total shareholder return (TSR)
versus the oil majors, and 50% on a balanced scorecard of underlying
performance factors versus the same peers. The underlying performance
factors were production growth, Refining and Marketing profitability, and
underlying net income growth. The peer group included ExxonMobil,
Shell, Total, Chevron and ConocoPhillips. Vesting was set at 100%, 70%
and 35% for performance equivalent to first, second, and third rank
respectively and none for fourth or fifth place.
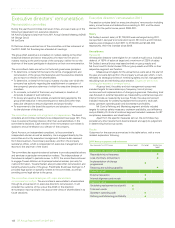
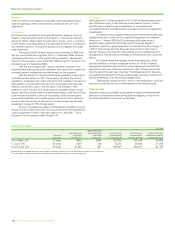
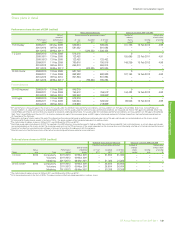
Salary
Cash bonus
Deferred bonus (before match)
Share element vesting
R W Dudley
Salary
Cash bonus
Deferred bonus (before match)
Share element vesting
Salary
Cash bonus
Deferred bonus (before match)
Share element vesting
I C Conn
Dr B E Grote
$1,700
$850
$1,700
$688
£720
£396
£792
£626
$1,427
$713
$1,427
$1,267
thousand
2011 total remuneration outcomes
Results
Reflecting the impact of the Deepwater Horizon oil spill, the TSR,
production growth and net income growth measures for the three-year
period 2009-2011 were all below the third place required for vesting.
Refining and Marketing profitability was strong and based on a first
place ranking achieved full vesting for that portion. Based on the agreed
formula, this resulted in a vesting of 16.67% of the original award.
The committee considered this result was a fair reflection of
overall performance over the period. The resulting shares and value of the
vesting is shown in the table on page 149.
2011 total remuneration outcomes
The charts below summarize the actual total remuneration outcome of
2011 for each of the executive directors.
The salary is the amount actually received during the year and
the cash bonus reflects the portion of total bonus for 2011 that is
received in cash.
The deferred bonus reflects that portion of total bonus for 2011
that is deferred, either on a mandatory or voluntary basis. The value
shown is converted to shares, matched one-for-one and vests after three
years contingent on the review of safety and environmental sustainability
over the three years.
Finally the share element portion reflects the value of the vesting
that occurred for the 2009-2011 plan. These shares now enter a further
three-year retention period before they are released to the individual.