BP 2011 Annual Report Download - page 219
Download and view the complete annual report
Please find page 219 of the 2011 BP annual report below. You can navigate through the pages in the report by either clicking on the pages listed below, or by using the keyword search tool below to find specific information within the annual report.-
 1
1 -
2
-
3
-
4
-
5
-
6
-
7
-
8
-
9
-
10
-
11
-
12
-
13
-
14
-
15
-
16
-
17
-
18
-
19
-
20
-
21
-
22
-
23
-
24
-
25
-
26
-
27
-
28
-
29
-
30
-
31
-
32
-
33
-
34
-
35
-
36
-
37
-
38
-
39
-
40
-
41
-
42
-
43
-
44
-
45
-
46
-
47
-
48
-
49
-
50
-
51
-
52
-
53
-
54
-
55
-
56
-
57
-
58
-
59
-
60
-
61
-
62
-
63
-
64
-
65
-
66
-
67
-
68
-
69
-
70
-
71
-
72
-
73
-
74
-
75
-
76
-
77
-
78
-
79
-
80
-
81
-
82
-
83
-
84
-
85
-
86
-
87
-
88
-
89
-
90
-
91
-
92
-
93
-
94
-
95
-
96
-
97
-
98
-
99
-
100
-
101
-
102
-
103
-
104
-
105
-
106
-
107
-
108
-
109
-
110
-
111
-
112
-
113
-
114
-
115
-
116
-
117
-
118
-
119
-
120
-
121
-
122
-
123
-
124
-
125
-
126
-
127
-
128
-
129
-
130
-
131
-
132
-
133
-
134
-
135
-
136
-
137
-
138
-
139
-
140
-
141
-
142
-
143
-
144
-
145
-
146
-
147
-
148
-
149
-
150
-
151
-
152
-
153
-
154
-
155
-
156
-
157
-
158
-
159
-
160
-
161
-
162
-
163
-
164
-
165
-
166
-
167
-
168
-
169
-
170
-
171
-
172
-
173
-
174
-
175
-
176
-
177
-
178
-
179
-
180
-
181
-
182
-
183
-
184
-
185
-
186
-
187
-
188
-
189
-
190
-
191
-
192
-
193
-
194
-
195
-
196
-
197
-
198
-
199
-
200
-
201
-
202
-
203
-
204
-
205
-
206
-
207
-
208
-
 209
209 -
 210
210 -
 211
211 -
 212
212 -
 213
213 -
 214
214 -
 215
215 -
 216
216 -
 217
217 -
 218
218 -
 219
219 -
 220
220 -
 221
221 -
 222
222 -
 223
223 -
 224
224 -
 225
225 -
 226
226 -
 227
227 -
 228
228 -
 229
229 -
230
-
231
-
232
-
233
-
234
-
235
-
236
-
237
-
238
-
239
-
240
-
241
-
242
-
243
-
244
-
245
-
246
-
247
-
248
-
249
-
250
-
251
-
252
-
253
-
254
-
255
-
256
-
257
-
258
-
259
-
260
-
261
-
262
-
263
-
264
-
265
-
266
-
267
-
268
-
269
-
270
-
271
-
272
-
273
-
274
-
275
-
276
-
277
-
278
-
279
-
280
-
281
-
282
-
283
-
284
-
285
-
286
-
287
-
288
-
289
-
290
-
291
-
292
-
293
-
294
-
295
-
296
-
297
-
298
-
299
-
300
 |
 |

Financial statements
BP Annual Report and Form 20-F 2011 217
Notes on financial statements
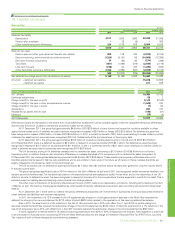
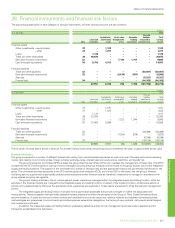
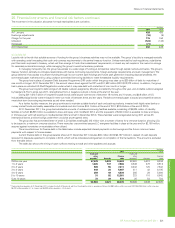
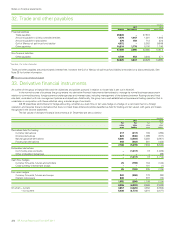
26. Financial instruments and financial risk factors
The accounting classification of each category of financial instruments, and their carrying amounts, are set out below.
$ million
At 31 December 2011
Note
Loans and
receivables
Available-for-
sale financial
assets
At fair value
through profit
or loss
Derivative
hedging
instruments
Financial
liabilities
measured at
amortized cost
Total
carrying
amount
Financial assets
Other investments – equity shares 27 – 1,128 –––1,128
– other 27 – 1,277 –––1,277
Loans 1,128 ––––1,128
Trade and other receivables 29 36,879 ––––36,879
Derivative financial instruments 33 – – 7,188 1,707 –8,895
Cash and cash equivalents 30 9,750 4,317 –––14,067
Financial liabilities
Trade and other payables 32 – – – – (50,651) (50,651)
Derivative financial instruments 33 – – (6,436) (557) –(6,993)
Accruals ––––(6,321) (6,321)
Finance debt 34 – – – – (44,183) (44,183)
47,757 6,722 752 1,150 (101,155) (44,774)
$ million
At 31 December 2010
Note
Loans and
receivables
Available-for-
sale financial
assets
At fair value
through profit
or loss
Derivative
hedging
instruments
Financial
liabilities
measured at
amortized cost
Total
carrying
amount
Financial assets
Other investments – equity shares 27 – 1,191 –––1,191
– other 27 – 1,532 –––1,532
Loans 1,141 ––––1,141
Trade and other receivables 29 32,380 – – – – 32,380
Derivative financial instruments 33 – – 7,222 1,344 –8,566
Cash and cash equivalents 30 13,462 5,094 – – – 18,556
Financial liabilities
Trade and other payables 32 – – – – (56,499) (56,499)
Derivative financial instruments 33 – – (7,254) (279) –(7,533)
Accruals ––––(6,249) (6,249)
Finance debt 34 – – – – (39,139) (39,139)
46,983 7,817 (32) 1,065 (101,887) (46,054)
The fair value of finance debt is shown in Note 34. For all other financial instruments, the carrying amount is either the fair value, or approximates the fair value.
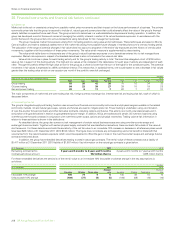
Financial risk factors
The group is exposed to a number of different financial risks arising from natural business exposures as well as its use of financial instruments including:
market risks relating to commodity prices, foreign currency exchange rates, interest rates and equity prices; credit risk; and liquidity risk.
The group financial risk committee (GFRC) advises the group chief financial officer (CFO) who oversees the management of these risks. The GFRC
is chaired by the CFO and consists of a group of senior managers including the group treasurer and the heads of the group finance, tax and the integrated
supply and trading functions. The purpose of the committee is to advise on financial risks and the appropriate financial risk governance framework for the
group. The committee provides assurance to the CFO and the group chief executive (GCE), and via the GCE to the board, that the group’s financial
risk-taking activity is governed by appropriate policies and procedures and that financial risks are identified, measured and managed in accordance with
group policies and group risk appetite.
The group’s trading activities in the oil, natural gas and power markets are managed within the integrated supply and trading function, while the
activities in the financial markets are managed by the integrated supply and trading function, on behalf of the treasury function. All derivative activity is
carried out by specialist teams that have the appropriate skills, experience and supervision. These teams are subject to close financial and management
control.
The integrated supply and trading function maintains formal governance processes that provide oversight of market risk associated with
trading activity. These processes meet generally accepted industry practice and reflect the principles of the Group of Thirty Global Derivatives Study
recommendations. A policy and risk committee monitors and validates limits and risk exposures, reviews incidents and validates risk-related policies,
methodologies and procedures. A commitments committee approves value-at-risk delegations, the trading of new products, instruments and strategies
and material commitments.
In addition, the integrated supply and trading function undertakes derivative activity for risk management purposes under a separate control
framework as described more fully below.