BP 2011 Annual Report Download - page 250
Download and view the complete annual report
Please find page 250 of the 2011 BP annual report below. You can navigate through the pages in the report by either clicking on the pages listed below, or by using the keyword search tool below to find specific information within the annual report.-
 1
1 -
2
-
3
-
4
-
5
-
6
-
7
-
8
-
9
-
10
-
11
-
12
-
13
-
14
-
15
-
16
-
17
-
18
-
19
-
20
-
21
-
22
-
23
-
24
-
25
-
26
-
27
-
28
-
29
-
30
-
31
-
32
-
33
-
34
-
35
-
36
-
37
-
38
-
39
-
40
-
41
-
42
-
43
-
44
-
45
-
46
-
47
-
48
-
49
-
50
-
51
-
52
-
53
-
54
-
55
-
56
-
57
-
58
-
59
-
60
-
61
-
62
-
63
-
64
-
65
-
66
-
67
-
68
-
69
-
70
-
71
-
72
-
73
-
74
-
75
-
76
-
77
-
78
-
79
-
80
-
81
-
82
-
83
-
84
-
85
-
86
-
87
-
88
-
89
-
90
-
91
-
92
-
93
-
94
-
95
-
96
-
97
-
98
-
99
-
100
-
101
-
102
-
103
-
104
-
105
-
106
-
107
-
108
-
109
-
110
-
111
-
112
-
113
-
114
-
115
-
116
-
117
-
118
-
119
-
120
-
121
-
122
-
123
-
124
-
125
-
126
-
127
-
128
-
129
-
130
-
131
-
132
-
133
-
134
-
135
-
136
-
137
-
138
-
139
-
140
-
141
-
142
-
143
-
144
-
145
-
146
-
147
-
148
-
149
-
150
-
151
-
152
-
153
-
154
-
155
-
156
-
157
-
158
-
159
-
160
-
161
-
162
-
163
-
164
-
165
-
166
-
167
-
168
-
169
-
170
-
171
-
172
-
173
-
174
-
175
-
176
-
177
-
178
-
179
-
180
-
181
-
182
-
183
-
184
-
185
-
186
-
187
-
188
-
189
-
190
-
191
-
192
-
193
-
194
-
195
-
196
-
197
-
198
-
199
-
200
-
201
-
202
-
203
-
204
-
205
-
206
-
207
-
208
-
209
-
210
-
211
-
212
-
213
-
214
-
215
-
216
-
217
-
218
-
219
-
220
-
221
-
222
-
223
-
224
-
225
-
226
-
227
-
228
-
229
-
230
-
231
-
232
-
233
-
234
-
235
-
236
-
237
-
238
-
239
-
 240
240 -
 241
241 -
 242
242 -
 243
243 -
 244
244 -
 245
245 -
 246
246 -
 247
247 -
 248
248 -
 249
249 -
 250
250 -
 251
251 -
 252
252 -
 253
253 -
 254
254 -
 255
255 -
 256
256 -
 257
257 -
 258
258 -
 259
259 -
 260
260 -
261
-
262
-
263
-
264
-
265
-
266
-
267
-
268
-
269
-
270
-
271
-
272
-
273
-
274
-
275
-
276
-
277
-
278
-
279
-
280
-
281
-
282
-
283
-
284
-
285
-
286
-
287
-
288
-
289
-
290
-
291
-
292
-
293
-
294
-
295
-
296
-
297
-
298
-
299
-
300
 |
 |

248 BP Annual Report and Form 20-F 2011
Notes on financial statements
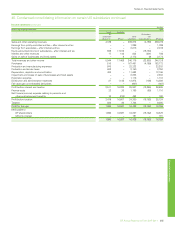
41. Employee costs and numbers
$ million
Employee costs 2011 2010 2009
Wages and salariesa9,827 9,242 9,702
Social security costs 851 789 780
Share-based payments 584 576 521
Pension and other post-retirement benefit costs 1,065 1,166 1,213
12,327 11,773 12,216
Number of employees at 31 December 2011 2010 2009
Exploration and Production 22,200 21,100 21,500
Refining and Marketingb51,000 52,300 51,600
Other businesses and corporate 10,100 6,200 7,200
Gulf Coast Restoration Organization 100 100 –
83,400 79,700 80,300
By geographical area
US 22,900 22,100 22,800
Non-USb60,500 57,600 57,500
83,400 79,700 80,300
2011 2010 2009
Average number of employees US Non-US Total US Non-US Total US Non-US Total
Exploration and Production 8,500 13,200 21,700 8,100 13,500 21,600 7,900 13,800 21,700
Refining and Marketing 12,300 39,200 51,500 12,600 38,300 50,900 14,700 40,700 55,400
Other businesses and corporate 1,700 6,500 8,200 1,900 5,000 6,900 2,300 5,800 8,100
Gulf Coast Restoration Organization 100 –100 ––––––
22,600 58,900 81,500 22,600 56,800 79,400 24,900 60,300 85,200
a Includes termination payments of $126 million (2010 $166 million and 2009 $945 million).
b Includes 14,600 (2010 15,200 and 2009 13,900) service station staff.
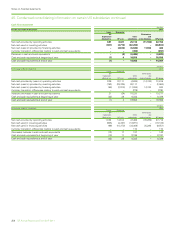
42. Remuneration of directors and senior management
Remuneration of directors
$ million
2011 2010 2009
Total for all directors
Emoluments 10 15 19
Gains made on exercise of share options –2 2
Amounts awarded under incentive schemes 14 2
Emoluments
These amounts comprise fees paid to the non-executive chairman and the non-executive directors and, for executive directors, salary and benefits
earned during the relevant financial year, plus bonuses awarded for the year. There was no compensation for loss of office in 2011 (2010 $3 million and
2009 nil).
Pension contributions
During 2011 one executive director participated in a non-contributory pension plan established for UK employees by a separate trust fund to which
contributions are made by BP based on actuarial advice. Two US executive directors participated in the US BP Retirement Accumulation Plan during 2011.
Office facilities for former chairmen and deputy chairmen
It is customary for the company to make available to former chairmen and deputy chairmen, who were previously employed executives, the use of office
and basic secretarial facilities following their retirement. The cost involved in doing so is not significant.
Further information
Full details of individual directors’ remuneration are given in the directors’ remuneration report on pages 139 to 151.
Remuneration of directors and senior management
$ million
Total for all senior management 2011 2010 2009
Total for all senior management
Short-term employee benefits 34 25 36
Post-retirement benefits 33 3
Share-based payments 27 29 20