BP 2011 Annual Report Download - page 237
Download and view the complete annual report
Please find page 237 of the 2011 BP annual report below. You can navigate through the pages in the report by either clicking on the pages listed below, or by using the keyword search tool below to find specific information within the annual report.-
 1
1 -
2
-
3
-
4
-
5
-
6
-
7
-
8
-
9
-
10
-
11
-
12
-
13
-
14
-
15
-
16
-
17
-
18
-
19
-
20
-
21
-
22
-
23
-
24
-
25
-
26
-
27
-
28
-
29
-
30
-
31
-
32
-
33
-
34
-
35
-
36
-
37
-
38
-
39
-
40
-
41
-
42
-
43
-
44
-
45
-
46
-
47
-
48
-
49
-
50
-
51
-
52
-
53
-
54
-
55
-
56
-
57
-
58
-
59
-
60
-
61
-
62
-
63
-
64
-
65
-
66
-
67
-
68
-
69
-
70
-
71
-
72
-
73
-
74
-
75
-
76
-
77
-
78
-
79
-
80
-
81
-
82
-
83
-
84
-
85
-
86
-
87
-
88
-
89
-
90
-
91
-
92
-
93
-
94
-
95
-
96
-
97
-
98
-
99
-
100
-
101
-
102
-
103
-
104
-
105
-
106
-
107
-
108
-
109
-
110
-
111
-
112
-
113
-
114
-
115
-
116
-
117
-
118
-
119
-
120
-
121
-
122
-
123
-
124
-
125
-
126
-
127
-
128
-
129
-
130
-
131
-
132
-
133
-
134
-
135
-
136
-
137
-
138
-
139
-
140
-
141
-
142
-
143
-
144
-
145
-
146
-
147
-
148
-
149
-
150
-
151
-
152
-
153
-
154
-
155
-
156
-
157
-
158
-
159
-
160
-
161
-
162
-
163
-
164
-
165
-
166
-
167
-
168
-
169
-
170
-
171
-
172
-
173
-
174
-
175
-
176
-
177
-
178
-
179
-
180
-
181
-
182
-
183
-
184
-
185
-
186
-
187
-
188
-
189
-
190
-
191
-
192
-
193
-
194
-
195
-
196
-
197
-
198
-
199
-
200
-
201
-
202
-
203
-
204
-
205
-
206
-
207
-
208
-
209
-
210
-
211
-
212
-
213
-
214
-
215
-
216
-
217
-
218
-
219
-
220
-
221
-
222
-
223
-
224
-
225
-
226
-
 227
227 -
 228
228 -
 229
229 -
 230
230 -
 231
231 -
 232
232 -
 233
233 -
 234
234 -
 235
235 -
 236
236 -
 237
237 -
 238
238 -
 239
239 -
 240
240 -
 241
241 -
 242
242 -
 243
243 -
 244
244 -
 245
245 -
 246
246 -
 247
247 -
248
-
249
-
250
-
251
-
252
-
253
-
254
-
255
-
256
-
257
-
258
-
259
-
260
-
261
-
262
-
263
-
264
-
265
-
266
-
267
-
268
-
269
-
270
-
271
-
272
-
273
-
274
-
275
-
276
-
277
-
278
-
279
-
280
-
281
-
282
-
283
-
284
-
285
-
286
-
287
-
288
-
289
-
290
-
291
-
292
-
293
-
294
-
295
-
296
-
297
-
298
-
299
-
300
 |
 |

Financial statements
BP Annual Report and Form 20-F 2011 235
Notes on financial statements
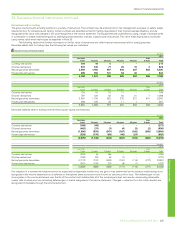
37. Pensions and other post-retirement benefits continued
Our assumptions for the rate of increase in salaries are based on our inflation rate assumption plus an allowance for expected long-term real salary
growth. These include allowance for promotion-related salary growth, of between 0.3% and 0.4% depending on country.
In addition to the financial assumptions, we regularly review the demographic and mortality assumptions. The mortality assumptions reflect best
practice in the countries in which we provide pensions, and have been chosen with regard to the latest available published tables adjusted where appropri-
ate to reflect the experience of the group and an extrapolation of past longevity improvements into the future. BP’s most substantial pension liabilities are
in the UK, the US and Germany where our mortality assumptions are as follows:
Years
Mortality assumptions UK US Germany
2011 2010 2009 2011 2010 2009 2011 2010 2009
Life expectancy at age 60 for a
male currently aged 60 27.6 26.1 26.0 24.8 24.7 24.6 23.5 23.3 23.2
Life expectancy at age 60 for a
male currently aged 40 30.5 29.1 29.0 26.3 26.2 26.1 26.3 26.2 26.1
Life expectancy at age 60 for a
female currently aged 60 29.3 28.7 28.6 26.4 26.3 26.3 28.0 27.9 27.8
Life expectancy at age 60 for a
female currently aged 40 32.0 31.6 31.5 27.3 27.2 27.2 30.7 30.6 30.4
Our assumption for future US healthcare cost trend rate for the first year after the reporting date reflects the rate of actual cost increases seen in recent
years. The ultimate trend rate reflects our long-term expectations of the level at which cost inflation will stabilize based on past healthcare cost inflation
seen over a longer period of time. The assumed future US healthcare cost trend rate assumptions are as follows:
%
2011 2010 2009
First year’s US healthcare cost trend rate 7.6 7.8 8.0
Ultimate US healthcare cost trend rate 5.0 5.0 5.0
Year in which ultimate trend rate is reached 2020 2018 2016
Pension plan assets are generally held in trusts. The primary objective of the trusts is to accumulate pools of assets sufficient to meet the obligations of
the various plans. The assets of the trusts are invested in a manner consistent with fiduciary obligations and principles that reflect current practices in
portfolio management.
A significant proportion of the assets are held in equities, owing to a higher expected level of return over the long term with an acceptable level of
risk. In order to provide reasonable assurance that no single security or type of security has an unwarranted impact on the total portfolio, the investment
portfolios are highly diversified. The long-term asset allocation policy for the major plans is as follows:
UK US Other
Asset category % % %
Total equity 73 70 17-63
Bonds/cash 20 30 25-75
Property/real estate 7 – 0-10
Some of the group’s pension plans use derivative financial instruments as part of their asset mix and to manage the level of risk. The group’s main pen-
sion plans do not invest directly in either securities or property/real estate of the company or of any subsidiary.
Return on asset assumptions reflect the group’s expectations built up by asset class and by plan. The group’s expectation is derived from
a combination of historical returns over the long term and the forecasts of market professionals. Our assumption for return on equities is based on a
long-term view, and the size of the resulting equity risk premium over government bond yields is reviewed each year for reasonableness. Our assumption
for return on bonds reflects the portfolio mix of government fixed-interest, index-linked and corporate bonds.