BP 2011 Annual Report Download - page 200
Download and view the complete annual report
Please find page 200 of the 2011 BP annual report below. You can navigate through the pages in the report by either clicking on the pages listed below, or by using the keyword search tool below to find specific information within the annual report.-
 1
1 -
2
-
3
-
4
-
5
-
6
-
7
-
8
-
9
-
10
-
11
-
12
-
13
-
14
-
15
-
16
-
17
-
18
-
19
-
20
-
21
-
22
-
23
-
24
-
25
-
26
-
27
-
28
-
29
-
30
-
31
-
32
-
33
-
34
-
35
-
36
-
37
-
38
-
39
-
40
-
41
-
42
-
43
-
44
-
45
-
46
-
47
-
48
-
49
-
50
-
51
-
52
-
53
-
54
-
55
-
56
-
57
-
58
-
59
-
60
-
61
-
62
-
63
-
64
-
65
-
66
-
67
-
68
-
69
-
70
-
71
-
72
-
73
-
74
-
75
-
76
-
77
-
78
-
79
-
80
-
81
-
82
-
83
-
84
-
85
-
86
-
87
-
88
-
89
-
90
-
91
-
92
-
93
-
94
-
95
-
96
-
97
-
98
-
99
-
100
-
101
-
102
-
103
-
104
-
105
-
106
-
107
-
108
-
109
-
110
-
111
-
112
-
113
-
114
-
115
-
116
-
117
-
118
-
119
-
120
-
121
-
122
-
123
-
124
-
125
-
126
-
127
-
128
-
129
-
130
-
131
-
132
-
133
-
134
-
135
-
136
-
137
-
138
-
139
-
140
-
141
-
142
-
143
-
144
-
145
-
146
-
147
-
148
-
149
-
150
-
151
-
152
-
153
-
154
-
155
-
156
-
157
-
158
-
159
-
160
-
161
-
162
-
163
-
164
-
165
-
166
-
167
-
168
-
169
-
170
-
171
-
172
-
173
-
174
-
175
-
176
-
177
-
178
-
179
-
180
-
181
-
182
-
183
-
184
-
185
-
186
-
187
-
188
-
189
-
 190
190 -
 191
191 -
 192
192 -
 193
193 -
 194
194 -
 195
195 -
 196
196 -
 197
197 -
 198
198 -
 199
199 -
 200
200 -
 201
201 -
 202
202 -
 203
203 -
 204
204 -
 205
205 -
 206
206 -
 207
207 -
 208
208 -
 209
209 -
 210
210 -
211
-
212
-
213
-
214
-
215
-
216
-
217
-
218
-
219
-
220
-
221
-
222
-
223
-
224
-
225
-
226
-
227
-
228
-
229
-
230
-
231
-
232
-
233
-
234
-
235
-
236
-
237
-
238
-
239
-
240
-
241
-
242
-
243
-
244
-
245
-
246
-
247
-
248
-
249
-
250
-
251
-
252
-
253
-
254
-
255
-
256
-
257
-
258
-
259
-
260
-
261
-
262
-
263
-
264
-
265
-
266
-
267
-
268
-
269
-
270
-
271
-
272
-
273
-
274
-
275
-
276
-
277
-
278
-
279
-
280
-
281
-
282
-
283
-
284
-
285
-
286
-
287
-
288
-
289
-
290
-
291
-
292
-
293
-
294
-
295
-
296
-
297
-
298
-
299
-
300
 |
 |

198 BP Annual Report and Form 20-F 2011
Notes on financial statements
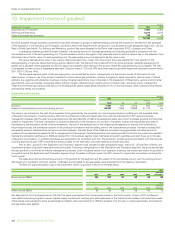
5. Disposals and impairment continued
Refining and Marketing
In 2011, gains on disposal resulted from our disposal of the fuels marketing business in Namibia, Malawi, Zambia and Tanzania to Puma Energy, certain
non-strategic pipelines and terminals in the US and other assets in the segment. Losses resulted from the disposal of a number of assets in the segment
portfolio.
In 2010, gains resulted from our disposals of the French retail fuels and convenience business to Delek Europe, the fuels marketing business in
Botswana to Puma Energy, certain non-strategic pipelines and terminals in the US, our interests in ethylene and polyethylene production in Malaysia to
Petronas and our interest in a futures exchange. Losses resulted from the disposal of a number of assets in the segment portfolio.
In 2009, gains on disposal mainly resulted from the disposal of our ground fuels marketing business in Greece and retail churn in the US, Europe
and Australasia. Losses resulted from the disposal of company-owned and company-operated retail sites in the US, retail churn and disposals of assets
elsewhere in the segment portfolio. Retail churn is the overall process of acquiring and disposing of retail sites by which the group aims to improve the
quality and mix of its portfolio of service stations.
Other businesses and corporate
In 2011, we disposed of our aluminium business in the US which resulted in a gain. We also contributed Mehoopany and Flat Ridge 2 wind energy
development assets in exchange for cash and 50% equity interests in the jointly controlled entities Mehoopany Wind Holdings LLC and Flat Ridge 2 Wind
Holdings LLC.
In 2010, we disposed of our 35% interest in K-Power, a gas-fired power asset in South Korea, and contributed our Cedar Creek 2 wind energy
development asset in exchange for a 50% equity interest in a jointly controlled entity, Cedar Creek II Holdings LLC (Cedar Creek 2) and cash. In addition,
there was a return of capital in the jointly controlled entities Fowler II Holdings LLC and Cedar Creek II Holdings LLC which did not change our percentage
interest in either entity.
During 2009, we disposed of our wind energy business in India and contributed our Fowler 2 wind energy development asset in the US in
exchange for a 50% equity interest in a jointly controlled entity, Fowler II Holdings LLC. In addition, there was a return of capital in the jointly controlled
entity Fowler Ridge Wind Farm LLC which did not change our percentage interest in the entity.
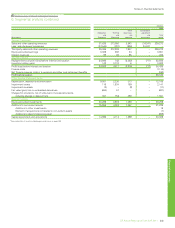
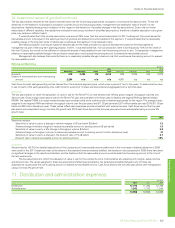
Summarized financial information relating to the sale of businesses is shown in the table below. Information relating to sales of fixed assets is
excluded from the table.
$ million
2011 2010 2009
Non-current assets 2,085 2,319 536
Current assets 1,008 310 444
Non-current liabilities (212) (303) (146)
Current liabilities (611) (124) (152)
Total carrying amount of net assets disposed 2,270 2,202 682
Recycling of foreign exchange on disposal 8(52) (27)
Costs on disposal 17 18 3
2,295 2,168 658
Profit on sale of businessesa2,232 1,968 314
Total consideration 4,527 4,136 972
Consideration received (receivable)b11 20 (6)
Proceeds from the sale of businesses related to completed transactions 4,538 4,156 966
Deposits received (repaid) related to assets classified as held for salec(3,530) 5,306 –
Disposals completed in relation to which deposits had been received in prior year (1,776) – –
Proceeds from the sale of businessesd(768) 9,462 966
a Of which $278 million gain was not recognized in the income statement in 2011 as it represented an unrealized gain on the sale of business assets in Vietnam to our associate TNK-BP.
b Consideration received from prior year business disposals or not yet received from current year disposals.
c 2010 included a deposit received in advance of $3,530 million in respect of the expected sale of our interest in Pan American Energy LLC; 2011 includes the repayment of the same amount following
the termination of the sale agreement as described in Note 4.
d Net of cash and cash equivalents disposed of $14 million (2010 $55 million and 2009 $91 million).
Impairment
In assessing whether a write-down is required in the carrying value of a potentially impaired intangible asset, item of property, plant and equipment or an
equity-accounted investment, the asset’s carrying value is compared with its recoverable amount. The recoverable amount is the higher of the asset’s fair
value less costs to sell and value in use. Unless indicated otherwise, the recoverable amount used in assessing the impairment losses described below
is value in use. The group estimates value in use using a discounted cash flow model. The future cash flows are adjusted for risks specific to the asset
and are discounted using a pre-tax discount rate. This discount rate is derived from the group’s post-tax weighted average cost of capital and is adjusted
where applicable to take into account any specific risks relating to the country where the cash-generating unit is located, although other rates may be used
if appropriate to the specific circumstances. In 2011 the rates used ranged from 12-14% (2010 11-14%). The rate applied in each country is reassessed
each year. In certain circumstances an impairment assessment may be carried out using fair value less costs to sell as the recoverable amount when, for
example, a recent market transaction for a similar asset has taken place. For impairments of available-for-sale financial assets that are quoted investments,
the fair value is determined by reference to bid prices at the close of business at the balance sheet date. Any cumulative loss previously recognized in
other comprehensive income is transferred to the income statement.