BP 2011 Annual Report Download - page 221
Download and view the complete annual report
Please find page 221 of the 2011 BP annual report below. You can navigate through the pages in the report by either clicking on the pages listed below, or by using the keyword search tool below to find specific information within the annual report.-
 1
1 -
2
-
3
-
4
-
5
-
6
-
7
-
8
-
9
-
10
-
11
-
12
-
13
-
14
-
15
-
16
-
17
-
18
-
19
-
20
-
21
-
22
-
23
-
24
-
25
-
26
-
27
-
28
-
29
-
30
-
31
-
32
-
33
-
34
-
35
-
36
-
37
-
38
-
39
-
40
-
41
-
42
-
43
-
44
-
45
-
46
-
47
-
48
-
49
-
50
-
51
-
52
-
53
-
54
-
55
-
56
-
57
-
58
-
59
-
60
-
61
-
62
-
63
-
64
-
65
-
66
-
67
-
68
-
69
-
70
-
71
-
72
-
73
-
74
-
75
-
76
-
77
-
78
-
79
-
80
-
81
-
82
-
83
-
84
-
85
-
86
-
87
-
88
-
89
-
90
-
91
-
92
-
93
-
94
-
95
-
96
-
97
-
98
-
99
-
100
-
101
-
102
-
103
-
104
-
105
-
106
-
107
-
108
-
109
-
110
-
111
-
112
-
113
-
114
-
115
-
116
-
117
-
118
-
119
-
120
-
121
-
122
-
123
-
124
-
125
-
126
-
127
-
128
-
129
-
130
-
131
-
132
-
133
-
134
-
135
-
136
-
137
-
138
-
139
-
140
-
141
-
142
-
143
-
144
-
145
-
146
-
147
-
148
-
149
-
150
-
151
-
152
-
153
-
154
-
155
-
156
-
157
-
158
-
159
-
160
-
161
-
162
-
163
-
164
-
165
-
166
-
167
-
168
-
169
-
170
-
171
-
172
-
173
-
174
-
175
-
176
-
177
-
178
-
179
-
180
-
181
-
182
-
183
-
184
-
185
-
186
-
187
-
188
-
189
-
190
-
191
-
192
-
193
-
194
-
195
-
196
-
197
-
198
-
199
-
200
-
201
-
202
-
203
-
204
-
205
-
206
-
207
-
208
-
209
-
210
-
 211
211 -
 212
212 -
 213
213 -
 214
214 -
 215
215 -
 216
216 -
 217
217 -
 218
218 -
 219
219 -
 220
220 -
 221
221 -
 222
222 -
 223
223 -
 224
224 -
 225
225 -
 226
226 -
 227
227 -
 228
228 -
 229
229 -
 230
230 -
 231
231 -
232
-
233
-
234
-
235
-
236
-
237
-
238
-
239
-
240
-
241
-
242
-
243
-
244
-
245
-
246
-
247
-
248
-
249
-
250
-
251
-
252
-
253
-
254
-
255
-
256
-
257
-
258
-
259
-
260
-
261
-
262
-
263
-
264
-
265
-
266
-
267
-
268
-
269
-
270
-
271
-
272
-
273
-
274
-
275
-
276
-
277
-
278
-
279
-
280
-
281
-
282
-
283
-
284
-
285
-
286
-
287
-
288
-
289
-
290
-
291
-
292
-
293
-
294
-
295
-
296
-
297
-
298
-
299
-
300
 |
 |

Financial statements
BP Annual Report and Form 20-F 2011 219
Notes on financial statements
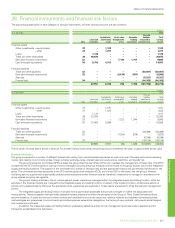
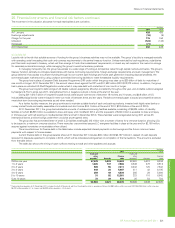
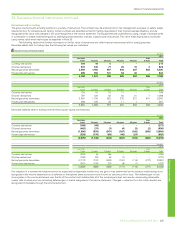
26. Financial instruments and financial risk factors continued
The sensitivities for risk management activity and embedded derivatives are hypothetical and should not be considered to be predictive of future
performance. In addition, for the purposes of this analysis, in the above table, the effect of a variation in a particular assumption on the fair value of the
embedded derivatives is calculated independently of any change in another assumption. In reality, changes in one factor may contribute to changes in
another, which may magnify or counteract the sensitivities. Furthermore, the estimated fair values as disclosed should not be considered indicative of
future earnings on these contracts.
(ii) Foreign currency exchange risk
Where the group enters into foreign currency exchange contracts for entrepreneurial trading purposes the activity is controlled using trading value-at-risk
techniques as explained above. This activity is included within oil price trading in the value-at-risk table above.
Since BP has global operations, fluctuations in foreign currency exchange rates can have significant effects on the group’s reported results. The
effects of most exchange rate fluctuations are absorbed in business operating results through changing cost competitiveness, lags in market adjustment
to movements in rates and translation differences accounted for on specific transactions. For this reason, the total effect of exchange rate fluctuations
is not identifiable separately in the group’s reported results. The main underlying economic currency of the group’s cash flows is the US dollar. This is
because BP’s major product, oil, is priced internationally in US dollars. BP’s foreign currency exchange management policy is to minimize economic
and material transactional exposures arising from currency movements against the US dollar. The group co-ordinates the handling of foreign currency
exchange risks centrally, by netting off naturally-occurring opposite exposures wherever possible, and then dealing with any material residual foreign
currency exchange risks.
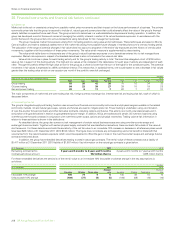
The group manages these exposures by constantly reviewing the foreign currency economic value at risk and aims to manage such risk to
keep the 12-month foreign currency value at risk below $200 million. At 31 December 2011, the foreign currency value at risk was $100 million (2010
$81 million). At no point over the past three years did the value at risk exceed the maximum risk limit. The most significant exposures relate to capital
expenditure commitments and other UK and European operational requirements, for which a hedging programme is in place and hedge accounting is
claimed as outlined in Note 33.
For highly probable forecast capital expenditures the group locks in the US dollar cost of non-US dollar supplies by using currency forwards and
futures. The main exposures are sterling, euro, Norwegian krone, Australian dollar and Korean won and at 31 December 2011 open contracts were in
place for $1,242 million sterling, $158 million euro, $118 million Norwegian krone, $210 million Australian dollar and $230 million Korean won capital
expenditures maturing within five years, with over 69% of the deals maturing within two years (2010 $989 million sterling, $115 million euro, $212 million
Norwegian krone and $143 million Australian dollar capital expenditures maturing within five years, with over 80% of the deals maturing within two years).
For other UK, European and Australian operational requirements the group uses cylinders and currency forwards to hedge the estimated
exposures on a 12-month rolling basis. At 31 December 2011, the open positions relating to cylinders consisted of receive sterling, pay US dollar,
purchased call and sold put options (cylinders) for $2,683 million (2010 $1,340 million); receive euro, pay US dollar cylinders for $1,304 million (2010
$650 million); receive Australian dollar, pay US dollar cylinders for $312 million (2010 $286 million). At 31 December 2011 there were no open positions
relating to currency forwards (2010 buy sterling, sell US dollar currency forwards for $925 million; buy euro, sell US dollar currency forwards for $630
million; buy Canadian dollar, sell US dollar currency forwards for $162 million).
In addition, most of the group’s borrowings are in US dollars or are hedged with respect to the US dollar. At 31 December 2011, the total foreign
currency net borrowings not swapped into US dollars amounted to $371 million (2010 $278 million). Of this total, $129 million was denominated in
currencies other than the functional currency of the individual operating unit being entirely Canadian dollars (2010 $125 million, being entirely Canadian
dollars). It is estimated that a 10% change in the corresponding exchange rates would result in an exchange gain or loss in the income statement of
$13 million (2010 $12 million).
(iii) Interest rate risk
Where the group enters into money market contracts for entrepreneurial trading purposes the activity is controlled using value-at-risk techniques as
described above. This activity is included within oil price trading in the value-at-risk table above.
BP is also exposed to interest rate risk from the possibility that changes in interest rates will affect future cash flows or the fair values of its
financial instruments, principally finance debt.
While the group issues debt in a variety of currencies based on market opportunities, it uses derivatives to swap the debt to a floating rate
exposure, mainly to US dollar floating, but in certain defined circumstances maintains a US dollar fixed rate exposure for a proportion of debt. The
proportion of floating rate debt net of interest rate swaps and excluding disposal deposits at 31 December 2011 was 65% of total finance debt
outstanding (2010 62%). The weighted average interest rate on finance debt at 31 December 2011 is 2% (2010 2%) and the weighted average maturity
of fixed rate debt is five years (2010 five years).
The group’s earnings are sensitive to changes in interest rates on the floating rate element of the group’s finance debt. If the interest rates
applicable to floating rate instruments were to have increased by 1% on 1 January 2012, it is estimated that the group’s profit before taxation for 2012
would decrease by approximately $289 million (2010 $241 million decrease in 2011). This assumes that the amount and mix of fixed and floating rate
debt, including finance leases, remains unchanged from that in place at 31 December 2011 and that the change in interest rates is effective from the
beginning of the year. Where the interest rate applicable to an instrument is reset during a quarter it is assumed that this occurs at the beginning of the
quarter and remains unchanged for the rest of the year. In reality, the fixed/floating rate mix will fluctuate over the year and interest rates will change
continually. Furthermore, the effect on earnings shown by this analysis does not consider the effect of any other changes in general economic activity that
may accompany such an increase in interest rates.
(iv) Equity price risk
The group holds equity investments, typically made for strategic purposes, that are classified as non-current available-for-sale financial assets and are
measured initially at fair value with changes in fair value recognized in other comprehensive income. Accumulated fair value changes are recycled to the
income statement on disposal, or when the investment is impaired. No impairment losses have been recognized for the years presented relating to listed
non-current available-for-sale investments. For further information see Note 27.
At 31 December 2011, it is estimated that an increase of 10% in quoted equity prices would result in an immediate credit to other comprehensive
income of $87 million (2010 $95 million credit to other comprehensive income), while a decrease of 10% in quoted equity prices would result in an
immediate charge to other comprehensive income of $87 million (2010 $95 million charge to other comprehensive income).