BP 2011 Annual Report Download - page 206
Download and view the complete annual report
Please find page 206 of the 2011 BP annual report below. You can navigate through the pages in the report by either clicking on the pages listed below, or by using the keyword search tool below to find specific information within the annual report.-
 1
1 -
2
-
3
-
4
-
5
-
6
-
7
-
8
-
9
-
10
-
11
-
12
-
13
-
14
-
15
-
16
-
17
-
18
-
19
-
20
-
21
-
22
-
23
-
24
-
25
-
26
-
27
-
28
-
29
-
30
-
31
-
32
-
33
-
34
-
35
-
36
-
37
-
38
-
39
-
40
-
41
-
42
-
43
-
44
-
45
-
46
-
47
-
48
-
49
-
50
-
51
-
52
-
53
-
54
-
55
-
56
-
57
-
58
-
59
-
60
-
61
-
62
-
63
-
64
-
65
-
66
-
67
-
68
-
69
-
70
-
71
-
72
-
73
-
74
-
75
-
76
-
77
-
78
-
79
-
80
-
81
-
82
-
83
-
84
-
85
-
86
-
87
-
88
-
89
-
90
-
91
-
92
-
93
-
94
-
95
-
96
-
97
-
98
-
99
-
100
-
101
-
102
-
103
-
104
-
105
-
106
-
107
-
108
-
109
-
110
-
111
-
112
-
113
-
114
-
115
-
116
-
117
-
118
-
119
-
120
-
121
-
122
-
123
-
124
-
125
-
126
-
127
-
128
-
129
-
130
-
131
-
132
-
133
-
134
-
135
-
136
-
137
-
138
-
139
-
140
-
141
-
142
-
143
-
144
-
145
-
146
-
147
-
148
-
149
-
150
-
151
-
152
-
153
-
154
-
155
-
156
-
157
-
158
-
159
-
160
-
161
-
162
-
163
-
164
-
165
-
166
-
167
-
168
-
169
-
170
-
171
-
172
-
173
-
174
-
175
-
176
-
177
-
178
-
179
-
180
-
181
-
182
-
183
-
184
-
185
-
186
-
187
-
188
-
189
-
190
-
191
-
192
-
193
-
194
-
195
-
 196
196 -
 197
197 -
 198
198 -
 199
199 -
 200
200 -
 201
201 -
 202
202 -
 203
203 -
 204
204 -
 205
205 -
 206
206 -
 207
207 -
 208
208 -
 209
209 -
 210
210 -
 211
211 -
 212
212 -
 213
213 -
 214
214 -
 215
215 -
 216
216 -
217
-
218
-
219
-
220
-
221
-
222
-
223
-
224
-
225
-
226
-
227
-
228
-
229
-
230
-
231
-
232
-
233
-
234
-
235
-
236
-
237
-
238
-
239
-
240
-
241
-
242
-
243
-
244
-
245
-
246
-
247
-
248
-
249
-
250
-
251
-
252
-
253
-
254
-
255
-
256
-
257
-
258
-
259
-
260
-
261
-
262
-
263
-
264
-
265
-
266
-
267
-
268
-
269
-
270
-
271
-
272
-
273
-
274
-
275
-
276
-
277
-
278
-
279
-
280
-
281
-
282
-
283
-
284
-
285
-
286
-
287
-
288
-
289
-
290
-
291
-
292
-
293
-
294
-
295
-
296
-
297
-
298
-
299
-
300
 |
 |

204 BP Annual Report and Form 20-F 2011
Notes on financial statements
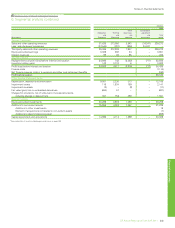
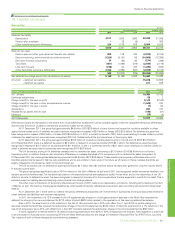
6. Segmental analysis continued
$ million
2011
By geographical area US Non-US Total
Revenues
Third party sales and other operating revenuesa131,488 244,029 375,517
Results
Replacement cost profit before interest and taxation 10,202 26,981 37,183
Non-current assets
Other non-current assetsb c 68,707 113,773 182,480
Other investments 2,117
Loans 884
Other receivables 4,337
Derivative financial instruments 5,038
Deferred tax assets 611
Defined benefit pension plan surpluses 17
Total non-current assets 195,484
Capital expenditure and acquisitions 8,830 22,688 31,518
a Non-US region includes UK $75,816 million.
b Non-US region includes UK $18,363 million.
c Excluding financial instruments, deferred tax assets and post-retirement benefit plan surpluses.
$ million
2010
By geographical area US Non-US Total
Revenues
Third party sales and other operating revenuesa101,768 195,339 297,107
Results
Replacement cost profit (loss) before interest and taxation (30,087) 24,601 (5,486)
Non-current assets
Other non-current assetsb c d 67,498 95,255 162,753
Other investments 1,191
Loans 894
Other receivables 6,298
Derivative financial instruments 4,210
Deferred tax assets 528
Defined benefit pension plan surpluses 2,176
Total non-current assets 178,050
Capital expenditure and acquisitions 10,370 12,646 23,016
a Non-US region includes UK $62,794 million.
b Non-US region includes UK $16,650 million.
c Excluding financial instruments, deferred tax assets and post-retirement benefit plan surpluses.
d Includes BP’s investment in Pan American Energy LLC following the termination of the sale agreement and the reinstatement of equity accounting. See Note 4 for further information.
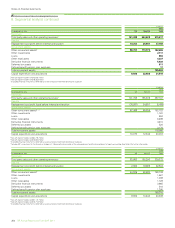
$ million
2009
By geographical area US Non-US Total
Revenues
Third party sales and other operating revenuesa83,982 155,290 239,272
Results
Replacement cost profit before interest and taxation 2,806 19,698 22,504
Non-current assets
Other non-current assetsb c 64,529 93,580 158,109
Other investments 1,567
Loans 1,039
Other receivables 1,729
Derivative financial instruments 3,965
Deferred tax assets 516
Defined benefit pension plan surpluses 1,390
Total non-current assets 168,315
Capital expenditure and acquisitions 9,865 10,444 20,309
a Non-US region includes UK $51,172 million.
b Non-US region includes UK $16,713 million.
c Excluding financial instruments, deferred tax assets and post-retirement benefit plan surpluses.
http://www.bp.com/downloads/segmentalanalysis