BP 2011 Annual Report Download - page 220
Download and view the complete annual report
Please find page 220 of the 2011 BP annual report below. You can navigate through the pages in the report by either clicking on the pages listed below, or by using the keyword search tool below to find specific information within the annual report.-
 1
1 -
2
-
3
-
4
-
5
-
6
-
7
-
8
-
9
-
10
-
11
-
12
-
13
-
14
-
15
-
16
-
17
-
18
-
19
-
20
-
21
-
22
-
23
-
24
-
25
-
26
-
27
-
28
-
29
-
30
-
31
-
32
-
33
-
34
-
35
-
36
-
37
-
38
-
39
-
40
-
41
-
42
-
43
-
44
-
45
-
46
-
47
-
48
-
49
-
50
-
51
-
52
-
53
-
54
-
55
-
56
-
57
-
58
-
59
-
60
-
61
-
62
-
63
-
64
-
65
-
66
-
67
-
68
-
69
-
70
-
71
-
72
-
73
-
74
-
75
-
76
-
77
-
78
-
79
-
80
-
81
-
82
-
83
-
84
-
85
-
86
-
87
-
88
-
89
-
90
-
91
-
92
-
93
-
94
-
95
-
96
-
97
-
98
-
99
-
100
-
101
-
102
-
103
-
104
-
105
-
106
-
107
-
108
-
109
-
110
-
111
-
112
-
113
-
114
-
115
-
116
-
117
-
118
-
119
-
120
-
121
-
122
-
123
-
124
-
125
-
126
-
127
-
128
-
129
-
130
-
131
-
132
-
133
-
134
-
135
-
136
-
137
-
138
-
139
-
140
-
141
-
142
-
143
-
144
-
145
-
146
-
147
-
148
-
149
-
150
-
151
-
152
-
153
-
154
-
155
-
156
-
157
-
158
-
159
-
160
-
161
-
162
-
163
-
164
-
165
-
166
-
167
-
168
-
169
-
170
-
171
-
172
-
173
-
174
-
175
-
176
-
177
-
178
-
179
-
180
-
181
-
182
-
183
-
184
-
185
-
186
-
187
-
188
-
189
-
190
-
191
-
192
-
193
-
194
-
195
-
196
-
197
-
198
-
199
-
200
-
201
-
202
-
203
-
204
-
205
-
206
-
207
-
208
-
209
-
 210
210 -
 211
211 -
 212
212 -
 213
213 -
 214
214 -
 215
215 -
 216
216 -
 217
217 -
 218
218 -
 219
219 -
 220
220 -
 221
221 -
 222
222 -
 223
223 -
 224
224 -
 225
225 -
 226
226 -
 227
227 -
 228
228 -
 229
229 -
 230
230 -
231
-
232
-
233
-
234
-
235
-
236
-
237
-
238
-
239
-
240
-
241
-
242
-
243
-
244
-
245
-
246
-
247
-
248
-
249
-
250
-
251
-
252
-
253
-
254
-
255
-
256
-
257
-
258
-
259
-
260
-
261
-
262
-
263
-
264
-
265
-
266
-
267
-
268
-
269
-
270
-
271
-
272
-
273
-
274
-
275
-
276
-
277
-
278
-
279
-
280
-
281
-
282
-
283
-
284
-
285
-
286
-
287
-
288
-
289
-
290
-
291
-
292
-
293
-
294
-
295
-
296
-
297
-
298
-
299
-
300
 |
 |

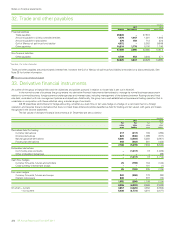
218 BP Annual Report and Form 20-F 2011
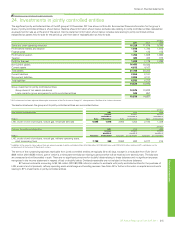
Notes on financial statements
26. Financial instruments and financial risk factors continued
(a) Market risk
Market risk is the risk or uncertainty arising from possible market price movements and their impact on the future performance of a business. The primary
commodity price risks that the group is exposed to include oil, natural gas and power prices that could adversely affect the value of the group’s financial
assets, liabilities or expected future cash flows. The group enters into derivatives in a well-established entrepreneurial trading operation. In addition, the
group has developed a control framework aimed at managing the volatility inherent in certain of its natural business exposures. In accordance with the
control framework the group enters into various transactions using derivatives for risk management purposes.
The group measures market risk exposure arising from its trading positions using value-at-risk techniques. These techniques are based on Monte
Carlo simulation and make a statistical assessment of the market risk arising from possible future changes in market prices over a one-day holding period.
The calculation of the range of potential changes in fair value takes into account a snapshot of the end-of-day exposures and the history of one-day price
movements, together with the correlation of these price movements. The value-at-risk measure is supplemented by stress testing.
The value-at-risk table does not incorporate any of the group’s natural business exposures or any derivatives entered into to risk manage those
exposures. Market risk exposure in respect of embedded derivatives is also not included in the value-at-risk table.
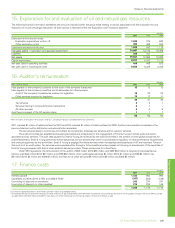
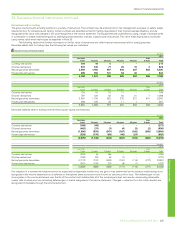
Value-at-risk limits are in place for each trading activity and for the group’s trading activity in total. The board has delegated a limit of $100 million
value at risk in support of this trading activity. The high and low values at risk indicated in the table below for each type of activity are independent of each
other. Through the portfolio effect the high value at risk for the group as a whole is lower than the sum of the highs for the constituent parts. The potential
movement in fair values is expressed to a 95% confidence interval. This means that, in statistical terms, one would expect to see a decrease in fair values
greater than the trading value at risk on one occasion per month if the portfolio were left unchanged.
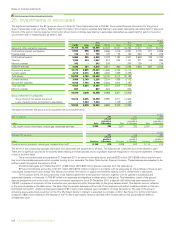
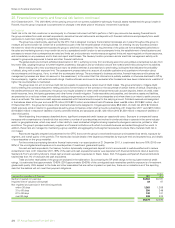
$ million
Value at risk for 1 day at 95% confidence interval 2011 2010
High Low Average Year end High Low Average Year end
Group trading 83 28 42 28 70 15 34 33
Oil price trading 84 23 39 27 39 10 19 25
Gas and power trading 20 611 762 727 18
The major components of market risk are commodity price risk, foreign currency exchange risk, interest rate risk and equity price risk, each of which is
discussed below.
(i) Commodity price risk
The group’s integrated supply and trading function uses conventional financial and commodity instruments and physical cargoes available in the related
commodity markets. Oil and natural gas swaps, options and futures are used to mitigate price risk. Power trading is undertaken using a combination
of over-the-counter forward contracts and other derivative contracts, including options and futures. This activity is on both a standalone basis and in
conjunction with gas derivatives in relation to gas-generated power margin. In addition, NGLs are traded around certain US inventory locations using
over-the-counter forward contracts in conjunction with over-the-counter swaps, options and physical inventories. Trading value-at-risk information in
relation to these activities is shown in the table above.
As described above, the group also carries out risk management of certain natural business exposures using over-the-counter swaps and
exchange futures contracts. Together with certain physical supply contracts that are classified as derivatives, these contracts fall outside of the value-at-
risk framework. For these derivative contracts the sensitivity of the net fair value to an immediate 10% increase or decrease in all reference prices would
have been $23 million at 31 December 2011 (2010 $104 million). This figure does not include any corresponding economic benefit or disbenefit that
would arise from the natural business exposure which would be expected to offset the gain or loss on the over-the-counter swaps and exchange futures
contracts mentioned above.
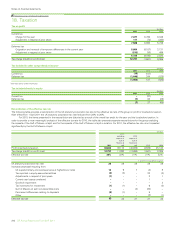
In addition, the group has embedded derivatives relating to certain natural gas contracts. The net fair value of these contracts was a liability of
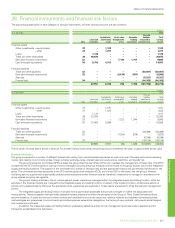
$1,417 million at 31 December 2011 (2010 liability of $1,607 million). Key information on the natural gas contracts is given below.
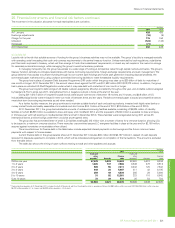
At 31 December 2011 2010
Remaining contract terms 3 years and 5 months to 6 years and 9 months 4 years and 5 months to 7 years and 9 months
Contractual/notional amount 952 million therms 1,688 million therms
For these embedded derivatives the sensitivity of the net fair value to an immediate 10% favourable or adverse change in the key assumptions is
as follows.
$ million
At 31 December 2011 2010
Gas price Oil price Power price
Discount
rate Gas price Oil price Power price
Discount
rate
Favourable 10% change 100 74 4 5 145 48 10 10
Unfavourable 10% change (109) (77) (4) (5) (180) (68) (10) (10)