BP 2011 Annual Report Download - page 266
Download and view the complete annual report
Please find page 266 of the 2011 BP annual report below. You can navigate through the pages in the report by either clicking on the pages listed below, or by using the keyword search tool below to find specific information within the annual report.-
 1
1 -
2
-
3
-
4
-
5
-
6
-
7
-
8
-
9
-
10
-
11
-
12
-
13
-
14
-
15
-
16
-
17
-
18
-
19
-
20
-
21
-
22
-
23
-
24
-
25
-
26
-
27
-
28
-
29
-
30
-
31
-
32
-
33
-
34
-
35
-
36
-
37
-
38
-
39
-
40
-
41
-
42
-
43
-
44
-
45
-
46
-
47
-
48
-
49
-
50
-
51
-
52
-
53
-
54
-
55
-
56
-
57
-
58
-
59
-
60
-
61
-
62
-
63
-
64
-
65
-
66
-
67
-
68
-
69
-
70
-
71
-
72
-
73
-
74
-
75
-
76
-
77
-
78
-
79
-
80
-
81
-
82
-
83
-
84
-
85
-
86
-
87
-
88
-
89
-
90
-
91
-
92
-
93
-
94
-
95
-
96
-
97
-
98
-
99
-
100
-
101
-
102
-
103
-
104
-
105
-
106
-
107
-
108
-
109
-
110
-
111
-
112
-
113
-
114
-
115
-
116
-
117
-
118
-
119
-
120
-
121
-
122
-
123
-
124
-
125
-
126
-
127
-
128
-
129
-
130
-
131
-
132
-
133
-
134
-
135
-
136
-
137
-
138
-
139
-
140
-
141
-
142
-
143
-
144
-
145
-
146
-
147
-
148
-
149
-
150
-
151
-
152
-
153
-
154
-
155
-
156
-
157
-
158
-
159
-
160
-
161
-
162
-
163
-
164
-
165
-
166
-
167
-
168
-
169
-
170
-
171
-
172
-
173
-
174
-
175
-
176
-
177
-
178
-
179
-
180
-
181
-
182
-
183
-
184
-
185
-
186
-
187
-
188
-
189
-
190
-
191
-
192
-
193
-
194
-
195
-
196
-
197
-
198
-
199
-
200
-
201
-
202
-
203
-
204
-
205
-
206
-
207
-
208
-
209
-
210
-
211
-
212
-
213
-
214
-
215
-
216
-
217
-
218
-
219
-
220
-
221
-
222
-
223
-
224
-
225
-
226
-
227
-
228
-
229
-
230
-
231
-
232
-
233
-
234
-
235
-
236
-
237
-
238
-
239
-
240
-
241
-
242
-
243
-
244
-
245
-
246
-
247
-
248
-
249
-
250
-
251
-
252
-
253
-
254
-
255
-
 256
256 -
 257
257 -
 258
258 -
 259
259 -
 260
260 -
 261
261 -
 262
262 -
 263
263 -
 264
264 -
 265
265 -
 266
266 -
 267
267 -
 268
268 -
 269
269 -
 270
270 -
 271
271 -
 272
272 -
 273
273 -
 274
274 -
 275
275 -
 276
276 -
277
-
278
-
279
-
280
-
281
-
282
-
283
-
284
-
285
-
286
-
287
-
288
-
289
-
290
-
291
-
292
-
293
-
294
-
295
-
296
-
297
-
298
-
299
-
300
 |
 |

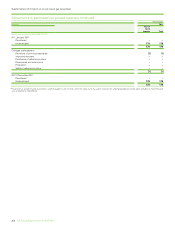
264 BP Annual Report and Form 20-F 2011
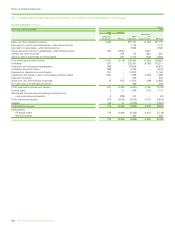
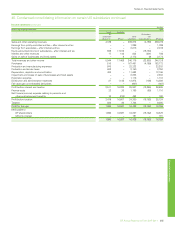
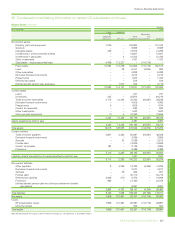
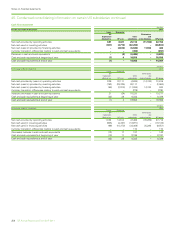
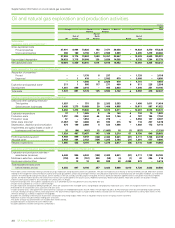
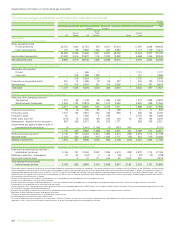
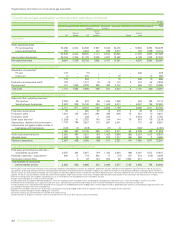
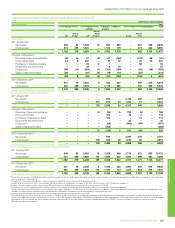
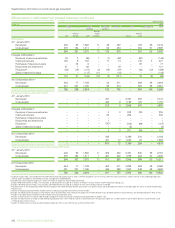
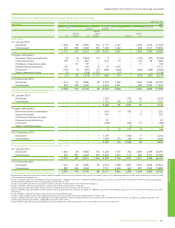
Supplementary information on oil and natural gas (unaudited)
Oil and natural gas exploration and production activities continued
$ million
2009
Europe North
America
South
America
Africa Asia Australasia Total
UK
Rest of
Europe US
Rest of
North
America Russia
Rest of
Asia
Subsidiariesa
Capitalized costs at 31 Decemberb
Gross capitalized costs
Proved properties 35,096 6,644 64,366 3,967 8,346 24,476 –10,900 2,894 156,689
Unproved properties 752 –5,464 147 198 2,377 –733 1,039 10,710
35,848 6,644 69,830 4,114 8,544 26,853 –11,633 3,933 167,399
Accumulated depreciation 26,794 3,306 31,728 2,309 4,837 12,492 –4,798 1,038 87,302
Net capitalized costs 9,054 3,338 38,102 1,805 3,707 14,361 –6,835 2,895 80,097
Costs incurred for the year ended 31 Decemberb
Acquisition of propertiesc
Proved 179 –(17) ––––306 –468
Unproved (1) –370 1 – 18 – – 10 398
178 –353 1 – 18 –306 10 866
Exploration and appraisal costsd183 –1,377 79 78 712 8315 53 2,805
Development 751 1,054 4,208 386 453 2,707 –560 277 10,396
Total costs 1,112 1,054 5,938 466 531 3,437 81,181 340 14,067
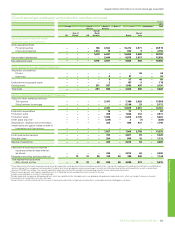
Results of operations for the year ended 31 December
Sales and other operating revenuese
Third parties 2,239 68 972 99 1,525 1,846 –636 785 8,170
Sales between businesses 2,482 809 15,100 484 1,409 5,313 –6,257 726 32,580
4,721 877 16,072 583 2,934 7,159 –6,893 1,511 40,750
Exploration expenditure 59 –663 80 16 219 849 22 1,116
Production costs 1,243 164 2,821 284 395 908 15 361 70 6,261
Production taxes (3) –649 1220 – – 2,854 72 3,793
Other costs (income)f(1,259) 51 2,353 145 184 144 76 967 178 2,839
Depreciation, depletion and amortization 1,148 185 3,857 170 697 2,041 –757 96 8,951
Impairments and (gains) losses on sale of
businesses and fixed assets (122) (7) (208) –(11) (1) –(702)j–(1,051)
1,066 393 10,135 680 1,501 3,311 99 4,286 438 21,909
Profit (loss) before taxationg3,655 484 5,937 (97) 1,433 3,848 (99) 2,607 1,073 18,841
Allocable taxes 1,568 76 1,902 (58) 916 1,517 (25) 682 26,580
Results of operations 2,087 408 4,035 (39) 517 2,331 (74) 1,925 1,071 12,261
Exploration and Production segment replacement cost profit before interest and tax
Exploration and production activities –
subsidiaries (as above) 3,655 484 5,937 (97) 1,433 3,848 (99) 2,607 1,073 18,841
Midstream activities – subsidiariesh j 925 17 719 833 17 (27) (37) 518 (315) 2,650
Equity-accounted entitiesi– 5 29 134 630 56 1,924 531 –3,309
Total replacement cost profit
before interest and tax 4,580 506 6,685 870 2,080 3,877 1,788 3,656 758 24,800
a These tables contain information relating to oil and natural gas exploration and production activities of subsidiaries. Midstream activities relating to the management and ownership of crude oil and natural
gas pipelines, processing and export terminals and LNG processing facilities and transportation are excluded. In addition, our midstream activities of marketing and trading of natural gas, power and NGLs in
the US, Canada, UK and Europe are excluded. The most significant midstream pipeline interests include the Trans-Alaska Pipeline System, the Forties Pipeline System, the Central Area Transmission System
pipeline, the South Caucasus Pipeline and the Baku-Tbilisi-Ceyhan pipeline. Major LNG activities are located in Trinidad, Indonesia and Australia and BP is also investing in the LNG business in Angola.
b Decommissioning assets are included in capitalized costs at 31 December but are excluded from costs incurred for the year.
c Includes costs capitalized as a result of asset exchanges.
d Includes exploration and appraisal drilling expenditures, which are capitalized within intangible assets, and geological and geophysical exploration costs, which are charged to income as incurred.
e Presented net of transportation costs, purchases and sales taxes. Sales between businesses and third party sales have been amended in the US without net effect to total sales.
f Includes property taxes, other government take and the fair value gain on embedded derivatives of $663 million. The UK region includes a $783 million gain offset by corresponding charges primarily in the
US, relating to the group self-insurance programme.
g Excludes the unwinding of the discount on provisions and payables amounting to $308 million which is included in finance costs in the group income statement.
h Midstream activities exclude inventory holding gains and losses.
i The profits of equity-accounted entities are included after interest and tax.
j Includes the gain on disposal of upstream assets associated with our sale of our 46% stake in LukArco (see Note 5).