BP 2011 Annual Report Download - page 283
Download and view the complete annual report
Please find page 283 of the 2011 BP annual report below. You can navigate through the pages in the report by either clicking on the pages listed below, or by using the keyword search tool below to find specific information within the annual report.-
 1
1 -
2
-
3
-
4
-
5
-
6
-
7
-
8
-
9
-
10
-
11
-
12
-
13
-
14
-
15
-
16
-
17
-
18
-
19
-
20
-
21
-
22
-
23
-
24
-
25
-
26
-
27
-
28
-
29
-
30
-
31
-
32
-
33
-
34
-
35
-
36
-
37
-
38
-
39
-
40
-
41
-
42
-
43
-
44
-
45
-
46
-
47
-
48
-
49
-
50
-
51
-
52
-
53
-
54
-
55
-
56
-
57
-
58
-
59
-
60
-
61
-
62
-
63
-
64
-
65
-
66
-
67
-
68
-
69
-
70
-
71
-
72
-
73
-
74
-
75
-
76
-
77
-
78
-
79
-
80
-
81
-
82
-
83
-
84
-
85
-
86
-
87
-
88
-
89
-
90
-
91
-
92
-
93
-
94
-
95
-
96
-
97
-
98
-
99
-
100
-
101
-
102
-
103
-
104
-
105
-
106
-
107
-
108
-
109
-
110
-
111
-
112
-
113
-
114
-
115
-
116
-
117
-
118
-
119
-
120
-
121
-
122
-
123
-
124
-
125
-
126
-
127
-
128
-
129
-
130
-
131
-
132
-
133
-
134
-
135
-
136
-
137
-
138
-
139
-
140
-
141
-
142
-
143
-
144
-
145
-
146
-
147
-
148
-
149
-
150
-
151
-
152
-
153
-
154
-
155
-
156
-
157
-
158
-
159
-
160
-
161
-
162
-
163
-
164
-
165
-
166
-
167
-
168
-
169
-
170
-
171
-
172
-
173
-
174
-
175
-
176
-
177
-
178
-
179
-
180
-
181
-
182
-
183
-
184
-
185
-
186
-
187
-
188
-
189
-
190
-
191
-
192
-
193
-
194
-
195
-
196
-
197
-
198
-
199
-
200
-
201
-
202
-
203
-
204
-
205
-
206
-
207
-
208
-
209
-
210
-
211
-
212
-
213
-
214
-
215
-
216
-
217
-
218
-
219
-
220
-
221
-
222
-
223
-
224
-
225
-
226
-
227
-
228
-
229
-
230
-
231
-
232
-
233
-
234
-
235
-
236
-
237
-
238
-
239
-
240
-
241
-
242
-
243
-
244
-
245
-
246
-
247
-
248
-
249
-
250
-
251
-
252
-
253
-
254
-
255
-
256
-
257
-
258
-
259
-
260
-
261
-
262
-
263
-
264
-
265
-
266
-
267
-
268
-
269
-
270
-
271
-
272
-
 273
273 -
 274
274 -
 275
275 -
 276
276 -
 277
277 -
 278
278 -
 279
279 -
 280
280 -
 281
281 -
 282
282 -
 283
283 -
 284
284 -
 285
285 -
 286
286 -
 287
287 -
 288
288 -
 289
289 -
 290
290 -
 291
291 -
 292
292 -
 293
293 -
294
-
295
-
296
-
297
-
298
-
299
-
300
 |
 |

Financial statements
BP Annual Report and Form 20-F 2011 281
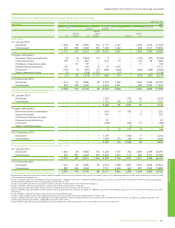
Supplementary information on oil and natural gas (unaudited)
Operational and statistical information (continued)
Net oil and gas wells completed or abandoned
The following table shows the number of net productive and dry exploratory and development oil and natural gas wells completed or abandoned in the
years indicated by the group and its equity-accounted entities. Productive wells include wells in which hydrocarbons were encountered and the drilling or
completion of which, in the case of exploratory wells, has been suspended pending further drilling or evaluation. A dry well is one found to be incapable of
producing hydrocarbons in sufficient quantities to justify completion.
Europe North
America
South
America
Africa Asia Australasia Total
UK
Rest of
Europe US
Rest of
North
America Russia
Rest of
Asia
2011
Exploratory
Productive 0.4 –34.1 –4.4 2.1 16.7 1.0 0.2 58.9
Dry – – 2.1 –0.2 –7.2 0.3 0.3 10.1
Development
Productive 1.7 –199.4 –101.3 16.0 582.0 45.1 –945.5
Dry – – 0.2 –3.0 2.7 –0.4 –6.3
2010
Exploratory
Productive –0.2 39.3 –1.3 1.2 10.5 2.8 0.3 55.6
Dry 0.7 –0.3 –0.9 1.4 4.0 – – 7.3
Development
Productive 6.4 1.2 260.0 31.7 105.7 18.9 364.3 53.3 –841.5
Dry 1.7 –0.5 –1.2 2.7 –2.4 –8.5
2009
Exploratory
Productive 0.1 –47.2 –3.0 4.5 7.0 5.3 0.6 67.7
Dry 0.2 –4.2 – – 1.4 4.5 6.0 0.2 16.5
Development
Productive 9.3 1.5 403.8 17.9 135.4 20.8 293.0 45.8 1.6 929.1
Dry – – 3.3 – – 0.5 4.0 0.4 0.6 8.8
Drilling and production activities in progress
The following table shows the number of exploratory and development oil and natural gas wells in the process of being drilled by the group and its equity-
accounted entities as of 31 December 2011. Suspended development wells and long-term suspended exploratory wells are also included in the table.
Europe North
America
South
America
Africa Asia Australasia Total
UK
Rest of
Europe US
Rest of
North
America Russia
Rest of
Asia
At 31 December 2011
Exploratory
Gross 1.0 –108.0 3.0 6.0 1.0 22.0 – – 141.0
Net 0.1 –30.5 1.5 2.3 0.2 10.5 – – 45.1
Development
Gross 6.0 1.0 748.0 36.0 16.0 36.0 209.0 37.0 –1,089.0
Net 4.2 0.4 235.7 18.0 9.2 13.2 101.2 10.3 –392.2