BP 2011 Annual Report Download - page 228
Download and view the complete annual report
Please find page 228 of the 2011 BP annual report below. You can navigate through the pages in the report by either clicking on the pages listed below, or by using the keyword search tool below to find specific information within the annual report.-
 1
1 -
2
-
3
-
4
-
5
-
6
-
7
-
8
-
9
-
10
-
11
-
12
-
13
-
14
-
15
-
16
-
17
-
18
-
19
-
20
-
21
-
22
-
23
-
24
-
25
-
26
-
27
-
28
-
29
-
30
-
31
-
32
-
33
-
34
-
35
-
36
-
37
-
38
-
39
-
40
-
41
-
42
-
43
-
44
-
45
-
46
-
47
-
48
-
49
-
50
-
51
-
52
-
53
-
54
-
55
-
56
-
57
-
58
-
59
-
60
-
61
-
62
-
63
-
64
-
65
-
66
-
67
-
68
-
69
-
70
-
71
-
72
-
73
-
74
-
75
-
76
-
77
-
78
-
79
-
80
-
81
-
82
-
83
-
84
-
85
-
86
-
87
-
88
-
89
-
90
-
91
-
92
-
93
-
94
-
95
-
96
-
97
-
98
-
99
-
100
-
101
-
102
-
103
-
104
-
105
-
106
-
107
-
108
-
109
-
110
-
111
-
112
-
113
-
114
-
115
-
116
-
117
-
118
-
119
-
120
-
121
-
122
-
123
-
124
-
125
-
126
-
127
-
128
-
129
-
130
-
131
-
132
-
133
-
134
-
135
-
136
-
137
-
138
-
139
-
140
-
141
-
142
-
143
-
144
-
145
-
146
-
147
-
148
-
149
-
150
-
151
-
152
-
153
-
154
-
155
-
156
-
157
-
158
-
159
-
160
-
161
-
162
-
163
-
164
-
165
-
166
-
167
-
168
-
169
-
170
-
171
-
172
-
173
-
174
-
175
-
176
-
177
-
178
-
179
-
180
-
181
-
182
-
183
-
184
-
185
-
186
-
187
-
188
-
189
-
190
-
191
-
192
-
193
-
194
-
195
-
196
-
197
-
198
-
199
-
200
-
201
-
202
-
203
-
204
-
205
-
206
-
207
-
208
-
209
-
210
-
211
-
212
-
213
-
214
-
215
-
216
-
217
-
 218
218 -
 219
219 -
 220
220 -
 221
221 -
 222
222 -
 223
223 -
 224
224 -
 225
225 -
 226
226 -
 227
227 -
 228
228 -
 229
229 -
 230
230 -
 231
231 -
 232
232 -
 233
233 -
 234
234 -
 235
235 -
 236
236 -
 237
237 -
 238
238 -
239
-
240
-
241
-
242
-
243
-
244
-
245
-
246
-
247
-
248
-
249
-
250
-
251
-
252
-
253
-
254
-
255
-
256
-
257
-
258
-
259
-
260
-
261
-
262
-
263
-
264
-
265
-
266
-
267
-
268
-
269
-
270
-
271
-
272
-
273
-
274
-
275
-
276
-
277
-
278
-
279
-
280
-
281
-
282
-
283
-
284
-
285
-
286
-
287
-
288
-
289
-
290
-
291
-
292
-
293
-
294
-
295
-
296
-
297
-
298
-
299
-
300
 |
 |

226 BP Annual Report and Form 20-F 2011
Notes on financial statements
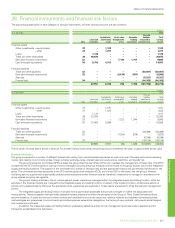
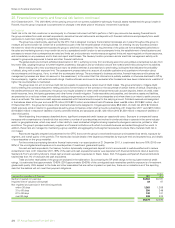
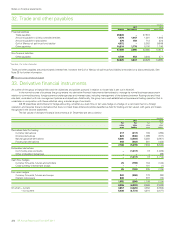
33. Derivative financial instruments continued
The following table shows the changes in the day-one profits and losses deferred on the balance sheet.
http://www.bp.com/downloads/dfi
$ million
2011 2010
Power price
Natural
gas price Oil price
Natural
gas price
Fair value of contracts not recognized through the income statement at 1 January –69 21 33
Fair value of new contracts at inception not recognized in the income statement 951 –39
Fair value recognized in the income statement –(6) (21) (3)
Fair value of contracts not recognized through profit at 31 December 9114 –69
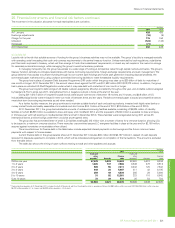
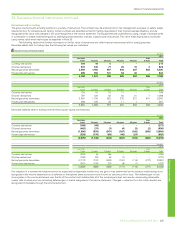
The following table shows the fair value of derivative assets and derivative liabilities held for trading, analysed by maturity period and by methodology of
fair value estimation.
IFRS 7 ‘Financial Instruments: Disclosures’ sets out a fair value hierarchy which consists of three levels that describe the methodology of
estimation as follows:
Level 1 – using quoted prices in active markets for identical assets or liabilities.
Level 2 – using inputs for the asset or liability, other than quoted prices, that are observable either directly (i.e. as prices) or indirectly
(i.e. derived from prices).
Level 3 – using inputs for the asset or liability that are not based on observable market data such as prices based on internal models or other
valuation methods.
This information is presented on a gross basis, that is, before netting by counterparty.
$ million
2011
Less than
1 year 1-2 years 2-3 years 3-4 years 4-5 years
Over
5 years Total
Fair value of derivative assets
Level 1 229 18 5 – – – 252
Level 2 7,225 2,725 1,123 269 81 811,431
Level 3 310 284 253 221 170 500 1,738
7,764 3,027 1,381 490 251 508 13,421
Less: netting by counterparty (4,006) (1,554) (601) (65) (4) (3) (6,233)
3,758 1,473 780 425 247 505 7,188
Fair value of derivative liabilities
Level 1 (168) (49) ––––(217)
Level 2 (6,323) (2,479) (887) (163) (21) (7) (9,880)
Level 3 (190) (164) (157) (149) (112) (383) (1,155)
(6,681) (2,692) (1,044) (312) (133) (390) (11,252)
Less: netting by counterparty 4,006 1,554 601 65 4 3 6,233
(2,675) (1,138) (443) (247) (129) (387) (5,019)
Net fair value 1,083 335 337 178 118 118 2,169
$ million
2010
Less than
1 year 1-2 years 2-3 years 3-4 years 4-5 years
Over
5 years Total
Fair value of derivative assets
Level 1 122 36 12 5 – – 175
Level 2 7,132 1,928 639 239 109 –10,047
Level 3 341 314 296 267 165 410 1,793
7,595 2,278 947 511 274 410 12,015
Less: netting by counterparty (3,694) (884) (160) (50) (21) (2) (4,811)
3,901 1,394 787 461 253 408 7,204
Fair value of derivative liabilities
Level 1 (239) (6) (46) –––(291)
Level 2 (6,733) (1,685) (617) (107) (44) –(9,186)
Level 3 (205) (148) (125) (114) (92) (279) (963)
(7,177) (1,839) (788) (221) (136) (279) (10,440)
Less: netting by counterparty 3,694 884 160 50 21 24,811
(3,483) (955) (628) (171) (115) (277) (5,629)
Net fair value 418 439 159 290 138 131 1,575