BP 2011 Annual Report Download - page 201
Download and view the complete annual report
Please find page 201 of the 2011 BP annual report below. You can navigate through the pages in the report by either clicking on the pages listed below, or by using the keyword search tool below to find specific information within the annual report.-
 1
1 -
2
-
3
-
4
-
5
-
6
-
7
-
8
-
9
-
10
-
11
-
12
-
13
-
14
-
15
-
16
-
17
-
18
-
19
-
20
-
21
-
22
-
23
-
24
-
25
-
26
-
27
-
28
-
29
-
30
-
31
-
32
-
33
-
34
-
35
-
36
-
37
-
38
-
39
-
40
-
41
-
42
-
43
-
44
-
45
-
46
-
47
-
48
-
49
-
50
-
51
-
52
-
53
-
54
-
55
-
56
-
57
-
58
-
59
-
60
-
61
-
62
-
63
-
64
-
65
-
66
-
67
-
68
-
69
-
70
-
71
-
72
-
73
-
74
-
75
-
76
-
77
-
78
-
79
-
80
-
81
-
82
-
83
-
84
-
85
-
86
-
87
-
88
-
89
-
90
-
91
-
92
-
93
-
94
-
95
-
96
-
97
-
98
-
99
-
100
-
101
-
102
-
103
-
104
-
105
-
106
-
107
-
108
-
109
-
110
-
111
-
112
-
113
-
114
-
115
-
116
-
117
-
118
-
119
-
120
-
121
-
122
-
123
-
124
-
125
-
126
-
127
-
128
-
129
-
130
-
131
-
132
-
133
-
134
-
135
-
136
-
137
-
138
-
139
-
140
-
141
-
142
-
143
-
144
-
145
-
146
-
147
-
148
-
149
-
150
-
151
-
152
-
153
-
154
-
155
-
156
-
157
-
158
-
159
-
160
-
161
-
162
-
163
-
164
-
165
-
166
-
167
-
168
-
169
-
170
-
171
-
172
-
173
-
174
-
175
-
176
-
177
-
178
-
179
-
180
-
181
-
182
-
183
-
184
-
185
-
186
-
187
-
188
-
189
-
190
-
 191
191 -
 192
192 -
 193
193 -
 194
194 -
 195
195 -
 196
196 -
 197
197 -
 198
198 -
 199
199 -
 200
200 -
 201
201 -
 202
202 -
 203
203 -
 204
204 -
 205
205 -
 206
206 -
 207
207 -
 208
208 -
 209
209 -
 210
210 -
 211
211 -
212
-
213
-
214
-
215
-
216
-
217
-
218
-
219
-
220
-
221
-
222
-
223
-
224
-
225
-
226
-
227
-
228
-
229
-
230
-
231
-
232
-
233
-
234
-
235
-
236
-
237
-
238
-
239
-
240
-
241
-
242
-
243
-
244
-
245
-
246
-
247
-
248
-
249
-
250
-
251
-
252
-
253
-
254
-
255
-
256
-
257
-
258
-
259
-
260
-
261
-
262
-
263
-
264
-
265
-
266
-
267
-
268
-
269
-
270
-
271
-
272
-
273
-
274
-
275
-
276
-
277
-
278
-
279
-
280
-
281
-
282
-
283
-
284
-
285
-
286
-
287
-
288
-
289
-
290
-
291
-
292
-
293
-
294
-
295
-
296
-
297
-
298
-
299
-
300
 |
 |

Financial statements
BP Annual Report and Form 20-F 2011 199
Notes on financial statements
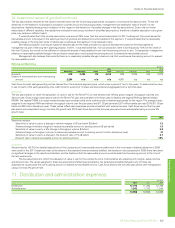
5. Disposals and impairment continued
Exploration and Production
During 2011, the Exploration and Production segment recognized impairment losses of $1,443 million. The main elements were a $555-million
impairment loss relating to a number of our interests in the Gulf of Mexico, caused by an increase in the decommissioning provision as a result of further
assessments of the regulations relating to idle infrastructure and a decrease in our assumption of the discount rate for provisions; the $393-million
write-down of our interest in the Fayetteville shale gas asset in the US, triggered by a decrease in value by reference to a sale transaction by a partner of
its interest in the same asset; and the $153-million write-down of our interest in the proposed Denali gas pipeline in Alaska, resulting from a decision not
to proceed with the project. There were several other impairment losses amounting to $342 million in total that were not individually significant. These
impairment losses were partly offset by reversals of impairment of certain of our interests in the Gulf of Mexico and Egypt amounting to $146 million in
total, triggered by an increase in our assumption of long-term oil prices.
During 2010, the Exploration and Production segment recognized impairment losses of $1,259 million. The main elements were the $501-million
write-down of assets in the Gulf of Mexico, triggered by an increase in the decommissioning provision as a result of new regulations in the US relating
to idle infrastructure; impairments of oil and gas properties in the Gulf of Mexico and onshore North America of $310 million and $80 million respectively,
as a result of decisions to dispose of assets at a price lower than the assets’ carrying values; a $341-million write-down of accumulated costs in Sakhalin,
Russia, triggered by a change in the outlook on the future recoverability of the investment; and several other individually insignificant impairment losses
amounting to $27 million in total.
During 2009, the Exploration and Production segment recognized impairment losses of $118 million. The main elements were the write-down of
our $42-million investment in the East Shmidt interest in Russia, triggered by a decision to not proceed to development; a $62-million charge associated
with our nErgize gas scheduling system; and several other individually insignificant impairment losses amounting to $14 million.
Refining and Marketing
During 2011, the Refining and Marketing segment recognized impairment losses of $599 million. Impairment losses of $398 million related to assets
classified as held for sale. Other impairment losses were also recognized relating to retail churn in Europe and other minor asset disposals amounting to
$201 million in total.
During 2010, the Refining and Marketing segment recognized impairment losses amounting to $144 million relating to retail churn in Europe and
other minor asset disposals. These losses were largely offset by the reversal of a previously recognized impairment loss of $141 million relating to the
investment in our jointly controlled entity China American Petrochemical Company resulting from a change in market conditions.
During 2009, an impairment loss of $1,579 million was recognized against the goodwill allocated to the US West Coast fuels value chain (FVC). The
goodwill was originally recognized at the time of the ARCO acquisition in 2000. The prevailing weak refining environment, together with a review of future
margin expectations in the FVC, led to a reduction in the expected future cash flows. Other impairment losses were also recognized by the segment on a
number of assets which amounted to $255 million.
Other businesses and corporate
During 2011, 2010 and 2009, Other businesses and corporate recognized impairment losses totalling $58 million, $113 million and $189 million
respectively related to various assets in the Alternative Energy business.