BP 2011 Annual Report Download - page 106
Download and view the complete annual report
Please find page 106 of the 2011 BP annual report below. You can navigate through the pages in the report by either clicking on the pages listed below, or by using the keyword search tool below to find specific information within the annual report.-
 1
1 -
2
-
3
-
4
-
5
-
6
-
7
-
8
-
9
-
10
-
11
-
12
-
13
-
14
-
15
-
16
-
17
-
18
-
19
-
20
-
21
-
22
-
23
-
24
-
25
-
26
-
27
-
28
-
29
-
30
-
31
-
32
-
33
-
34
-
35
-
36
-
37
-
38
-
39
-
40
-
41
-
42
-
43
-
44
-
45
-
46
-
47
-
48
-
49
-
50
-
51
-
52
-
53
-
54
-
55
-
56
-
57
-
58
-
59
-
60
-
61
-
62
-
63
-
64
-
65
-
66
-
67
-
68
-
69
-
70
-
71
-
72
-
73
-
74
-
75
-
76
-
77
-
78
-
79
-
80
-
81
-
82
-
83
-
84
-
85
-
86
-
87
-
88
-
89
-
90
-
91
-
92
-
93
-
94
-
95
-
 96
96 -
 97
97 -
 98
98 -
 99
99 -
 100
100 -
 101
101 -
 102
102 -
 103
103 -
 104
104 -
 105
105 -
 106
106 -
 107
107 -
 108
108 -
 109
109 -
 110
110 -
 111
111 -
 112
112 -
 113
113 -
 114
114 -
 115
115 -
 116
116 -
117
-
118
-
119
-
120
-
121
-
122
-
123
-
124
-
125
-
126
-
127
-
128
-
129
-
130
-
131
-
132
-
133
-
134
-
135
-
136
-
137
-
138
-
139
-
140
-
141
-
142
-
143
-
144
-
145
-
146
-
147
-
148
-
149
-
150
-
151
-
152
-
153
-
154
-
155
-
156
-
157
-
158
-
159
-
160
-
161
-
162
-
163
-
164
-
165
-
166
-
167
-
168
-
169
-
170
-
171
-
172
-
173
-
174
-
175
-
176
-
177
-
178
-
179
-
180
-
181
-
182
-
183
-
184
-
185
-
186
-
187
-
188
-
189
-
190
-
191
-
192
-
193
-
194
-
195
-
196
-
197
-
198
-
199
-
200
-
201
-
202
-
203
-
204
-
205
-
206
-
207
-
208
-
209
-
210
-
211
-
212
-
213
-
214
-
215
-
216
-
217
-
218
-
219
-
220
-
221
-
222
-
223
-
224
-
225
-
226
-
227
-
228
-
229
-
230
-
231
-
232
-
233
-
234
-
235
-
236
-
237
-
238
-
239
-
240
-
241
-
242
-
243
-
244
-
245
-
246
-
247
-
248
-
249
-
250
-
251
-
252
-
253
-
254
-
255
-
256
-
257
-
258
-
259
-
260
-
261
-
262
-
263
-
264
-
265
-
266
-
267
-
268
-
269
-
270
-
271
-
272
-
273
-
274
-
275
-
276
-
277
-
278
-
279
-
280
-
281
-
282
-
283
-
284
-
285
-
286
-
287
-
288
-
289
-
290
-
291
-
292
-
293
-
294
-
295
-
296
-
297
-
298
-
299
-
300
 |
 |

104 BP Annual Report and Form 20-F 2011
Business review
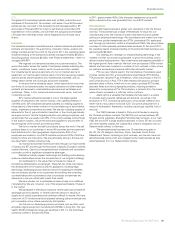
BP believes that, taking into account the amounts of undrawn borrowing
facilities and increased levels of cash and cash equivalents, and the
ongoing ability to generate cash, including further disposal proceeds, the
group has sufficient working capital for foreseeable requirements.
Uncertainty remains regarding the amount and timing of future
expenditures relating to the Deepwater Horizon oil spill and the implications
for future activities. See Risk factors on pages 59-63, and Financial
statements – Note 2 on page 190, Note 36 on page 231 and Note 43 on
page 249 for further information.
Off-balance sheet arrangements
At 31 December 2011, the group’s share of third-party finance debt of
equity-accounted entities was $7,003 million (2010 $6,987 million). These
amounts are not reflected in the group’s debt on the balance sheet.
The group has issued third-party guarantees under which amounts
outstanding at 31 December 2011 are $415 million (2010 $404 million) in
respect of liabilities of jointly controlled entities and associates and $1,430
million (2010 $1,339 million) in respect of liabilities of other third parties.
Of these amounts, $220 million (2010 $355 million) of the jointly controlled
entities and associates guarantees relate to borrowings and for other
third-party guarantees, $1,267 million (2010 $1,324 million) relates to
guarantees of borrowings. Details of operating lease commitments, which
are not recognized on the balance sheet, are shown in the table below and
in Note 14 on page 208.
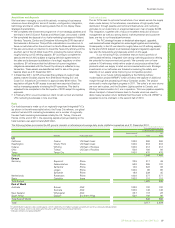
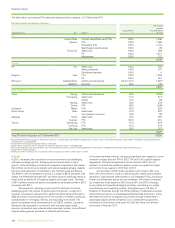
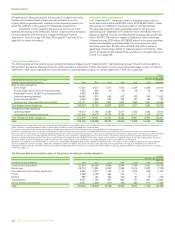
Contractual commitments
The following table summarizes the group’s principal contractual obligations at 31 December 2011, distinguishing between those for which a liability is
recognized on the balance sheet and those for which no liability is recognized. Further information on borrowings and finance leases is given in Financial
statements – Note 34 on page 229 and more information on operating leases is given in Financial statements – Note 14 on page 208.
$ million
Payments due by period
Expected payments by period under contractual
obligations and commercial commitments Total 2012 2013 2014 2015 2016
2017 and
thereafter
Balance sheet obligations
Borrowingsa47,242 9,570 7,812 7,262 5,438 4,586 12,574
Finance lease future minimum lease payments 1,034 454 54 49 49 48 380
Deepwater Horizon Oil Spill Trust funding liability 4,884 4,884 – – – – –
Decommissioning liabilitiesb19,693 610 546 433 305 346 17,453
Environmental liabilitiesb3,646 1,665 588 232 187 192 782
Pensions and other post-retirement benefitsc29,171 1,945 1,933 1,944 1,938 1,921 19,490
Total balance sheet obligations 105,670 19,128 10,933 9,920 7,917 7,093 50,679
Off-balance sheet obligations
Operating leasesd16,072 4,182 3,286 2,207 1,630 1,223 3,544
Unconditional purchase obligationse197,404 115,679 18,155 12,388 8,311 7,168 35,703
Total off-balance sheet obligations 213,476 119,861 21,441 14,595 9,941 8,391 39,247
Total 319,146 138,989 32,374 24,515 17,858 15,484 89,926
a Expected payments include interest payments on borrowings totalling $3,751 million ($896 million in 2012, $746 million in 2013, $582 million in 2014, $443 million in 2015, $333 million in 2016 and $751
million thereafter), and exclude disposal deposits of $30 million included in current finance debt on the balance sheet.
b The amounts are undiscounted. Environmental liabilities include those relating to the Gulf of Mexico oil spill, including liabilities for spill response costs.
c Represents the expected future contributions to funded pension plans and payments by the group for unfunded pension plans and the expected future payments for other post-retirement benefits.
d The future minimum lease payments are before deducting related rental income from operating sub-leases. In the case of an operating lease entered into solely by BP as the operator of a jointly controlled
asset, the amounts shown in the table represent the net future minimum lease payments, after deducting amounts reimbursed, or to be reimbursed, by joint venture partners. Where BP is not the
operator of a jointly controlled asset BP’s share of the future minimum lease payments are included in the amounts shown, whether BP has co-signed the lease or not. Where operating lease costs are
incurred in relation to the hire of equipment used in connection with a capital project, some or all of the cost may be capitalized as part of the capital cost of the project.
e Represents any agreement to purchase goods or services that is enforceable and legally binding and that specifies all significant terms. The amounts shown include arrangements to secure long-term
access to supplies of crude oil, natural gas, feedstocks and pipeline systems. In addition, the amounts shown for 2012 include purchase commitments existing at 31 December 2011 entered into
principally to meet the group’s short-term manufacturing and marketing requirements. The price risk associated with these crude oil, natural gas and power contracts is discussed in Financial statements
– Note 26 on page 217.
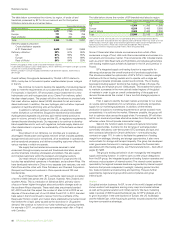
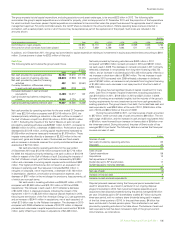
The following table summarizes the nature of the group’s unconditional purchase obligations.
$ million
Payments due by period
Unconditional purchase obligations Total 2012 2013 2014 2015 2016
2017 and
thereafter
Crude oil and oil products 130,824 90,690 9,095 5,684 3,344 2,853 19,158
Natural gas 38,370 17,591 5,258 3,589 2,516 2,087 7,329
Chemicals and other refinery feedstocks 9,962 2,573 1,129 1,115 1,028 979 3,138
Power 3,038 2,169 644 212 11 2 –
Utilities 892 181 154 106 97 75 279
Transportation 8,061 1,183 957 926 731 661 3,603
Use of facilities and services 6,257 1,292 918 756 584 511 2,196
Total 197,404 115,679 18,155 12,388 8,311 7,168 35,703