BP 2011 Annual Report Download - page 214
Download and view the complete annual report
Please find page 214 of the 2011 BP annual report below. You can navigate through the pages in the report by either clicking on the pages listed below, or by using the keyword search tool below to find specific information within the annual report.-
 1
1 -
2
-
3
-
4
-
5
-
6
-
7
-
8
-
9
-
10
-
11
-
12
-
13
-
14
-
15
-
16
-
17
-
18
-
19
-
20
-
21
-
22
-
23
-
24
-
25
-
26
-
27
-
28
-
29
-
30
-
31
-
32
-
33
-
34
-
35
-
36
-
37
-
38
-
39
-
40
-
41
-
42
-
43
-
44
-
45
-
46
-
47
-
48
-
49
-
50
-
51
-
52
-
53
-
54
-
55
-
56
-
57
-
58
-
59
-
60
-
61
-
62
-
63
-
64
-
65
-
66
-
67
-
68
-
69
-
70
-
71
-
72
-
73
-
74
-
75
-
76
-
77
-
78
-
79
-
80
-
81
-
82
-
83
-
84
-
85
-
86
-
87
-
88
-
89
-
90
-
91
-
92
-
93
-
94
-
95
-
96
-
97
-
98
-
99
-
100
-
101
-
102
-
103
-
104
-
105
-
106
-
107
-
108
-
109
-
110
-
111
-
112
-
113
-
114
-
115
-
116
-
117
-
118
-
119
-
120
-
121
-
122
-
123
-
124
-
125
-
126
-
127
-
128
-
129
-
130
-
131
-
132
-
133
-
134
-
135
-
136
-
137
-
138
-
139
-
140
-
141
-
142
-
143
-
144
-
145
-
146
-
147
-
148
-
149
-
150
-
151
-
152
-
153
-
154
-
155
-
156
-
157
-
158
-
159
-
160
-
161
-
162
-
163
-
164
-
165
-
166
-
167
-
168
-
169
-
170
-
171
-
172
-
173
-
174
-
175
-
176
-
177
-
178
-
179
-
180
-
181
-
182
-
183
-
184
-
185
-
186
-
187
-
188
-
189
-
190
-
191
-
192
-
193
-
194
-
195
-
196
-
197
-
198
-
199
-
200
-
201
-
202
-
203
-
 204
204 -
 205
205 -
 206
206 -
 207
207 -
 208
208 -
 209
209 -
 210
210 -
 211
211 -
 212
212 -
 213
213 -
 214
214 -
 215
215 -
 216
216 -
 217
217 -
 218
218 -
 219
219 -
 220
220 -
 221
221 -
 222
222 -
 223
223 -
 224
224 -
225
-
226
-
227
-
228
-
229
-
230
-
231
-
232
-
233
-
234
-
235
-
236
-
237
-
238
-
239
-
240
-
241
-
242
-
243
-
244
-
245
-
246
-
247
-
248
-
249
-
250
-
251
-
252
-
253
-
254
-
255
-
256
-
257
-
258
-
259
-
260
-
261
-
262
-
263
-
264
-
265
-
266
-
267
-
268
-
269
-
270
-
271
-
272
-
273
-
274
-
275
-
276
-
277
-
278
-
279
-
280
-
281
-
282
-
283
-
284
-
285
-
286
-
287
-
288
-
289
-
290
-
291
-
292
-
293
-
294
-
295
-
296
-
297
-
298
-
299
-
300
 |
 |

212 BP Annual Report and Form 20-F 2011
Notes on financial statements
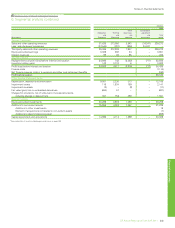
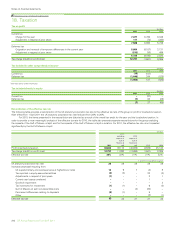
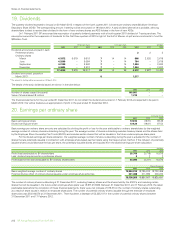
19. Dividends
The quarterly dividend expected to be paid on 30 March 2012 in respect of the fourth quarter 2011 is 8 cents per ordinary share ($0.48 per American
Depositary Share (ADS)). The corresponding amount in sterling will be announced on 19 March 2012. A scrip dividend alternative is available, allowing
shareholders to elect to receive their dividend in the form of new ordinary shares and ADS holders in the form of new ADSs.
On 1 February 2011 BP announced the resumption of quarterly dividend payments with a fourth-quarter 2010 dividend of 7 cents per share. The
resumption came after the suspension of dividends for the first three quarters of 2010 in light of the Gulf of Mexico oil spill and commitments to fund the
$20-billion Trust.
Pence per share Cents per share $ million
2011 2010 2009 2011 2010 2009 2011 2010 2009
Dividends announced and paid in cash
Preference shares 22 2
Ordinary shares
March 4.3372 8.679 9.818 714 14 808 2,625 2,619
June 4.2809 –9.584 7–14 794 –2,619
September 4.3160 –8.503 7–14 1,224 –2,620
December 4.4694 –8.512 7–14 1,244 –2,623
17.4035 8.679 36.417 28 14 56 4,072 2,627 10,483
Dividend announced, payable in
March 2012a81,517
a The amount in sterling will be announced on 19 March 2012.
The details of the scrip dividends issued are shown in the table below.
2011 2010 2009
Number of shares issued (thousand) 165,601 – –
Value of shares issued ($ million) 1,219 – –
The financial statements for the year ended 31 December 2011 do not reflect the dividend announced on 7 February 2012 and expected to be paid in
March 2012; this will be treated as an appropriation of profit in the year ended 31 December 2012.
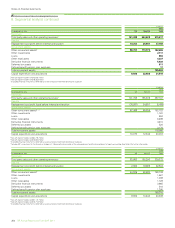
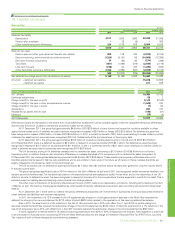
20. Earnings per ordinary share
Cents per share
2011 2010 2009
Basic earnings per share 135.93 (19.81) 88.49
Diluted earnings per share 134.29 (19.81) 87.54
Basic earnings per ordinary share amounts are calculated by dividing the profit or loss for the year attributable to ordinary shareholders by the weighted
average number of ordinary shares outstanding during the year. The average number of shares outstanding excludes treasury shares and the shares held
by the Employee Share Ownership Plan Trusts (ESOPs) and includes certain shares that will be issuable in the future under employee share plans.
For the diluted earnings per share calculation, the weighted average number of shares outstanding during the year is adjusted for the number of
shares that are potentially issuable in connection with employee share-based payment plans using the treasury stock method. If the inclusion of potentially
issuable shares would decrease the loss per share, the potentially issuable shares are excluded from the diluted earnings per share calculation.
$ million
2011 2010 2009
Profit (loss) attributable to BP shareholders 25,700 (3,719) 16,578
Less: dividend requirements on preference shares 22 2
Profit (loss) for the year attributable to BP ordinary shareholders 25,698 (3,721) 16,576
Shares thousand
2011 2010 2009
Basic weighted average number of ordinary shares 18,904,812 18,785,912 18,732,459
Potential dilutive effect of ordinary shares issuable under employee share schemes 231,388 211,895 203,232
19,136,200 18,997,807 18,935,691
The number of ordinary shares outstanding at 31 December 2011, excluding treasury shares and the shares held by the ESOPs, and including certain
shares that will be issuable in the future under employee share plans was 18,977,213,826. Between 31 December 2011 and 17 February 2012, the latest
practicable date before the completion of these financial statements, there was a net increase of 379,374 in the number of ordinary shares outstanding
as a result of share issues in relation to employee share plans. The number of potential ordinary shares issuable through the exercise of employee
share plans was 254,106,576 at 31 December 2011. There has been a decrease of 53,225,107 in the number of potential ordinary shares between
31 December 2011 and 17 February 2012.