BP 2011 Annual Report Download - page 204
Download and view the complete annual report
Please find page 204 of the 2011 BP annual report below. You can navigate through the pages in the report by either clicking on the pages listed below, or by using the keyword search tool below to find specific information within the annual report.-
 1
1 -
2
-
3
-
4
-
5
-
6
-
7
-
8
-
9
-
10
-
11
-
12
-
13
-
14
-
15
-
16
-
17
-
18
-
19
-
20
-
21
-
22
-
23
-
24
-
25
-
26
-
27
-
28
-
29
-
30
-
31
-
32
-
33
-
34
-
35
-
36
-
37
-
38
-
39
-
40
-
41
-
42
-
43
-
44
-
45
-
46
-
47
-
48
-
49
-
50
-
51
-
52
-
53
-
54
-
55
-
56
-
57
-
58
-
59
-
60
-
61
-
62
-
63
-
64
-
65
-
66
-
67
-
68
-
69
-
70
-
71
-
72
-
73
-
74
-
75
-
76
-
77
-
78
-
79
-
80
-
81
-
82
-
83
-
84
-
85
-
86
-
87
-
88
-
89
-
90
-
91
-
92
-
93
-
94
-
95
-
96
-
97
-
98
-
99
-
100
-
101
-
102
-
103
-
104
-
105
-
106
-
107
-
108
-
109
-
110
-
111
-
112
-
113
-
114
-
115
-
116
-
117
-
118
-
119
-
120
-
121
-
122
-
123
-
124
-
125
-
126
-
127
-
128
-
129
-
130
-
131
-
132
-
133
-
134
-
135
-
136
-
137
-
138
-
139
-
140
-
141
-
142
-
143
-
144
-
145
-
146
-
147
-
148
-
149
-
150
-
151
-
152
-
153
-
154
-
155
-
156
-
157
-
158
-
159
-
160
-
161
-
162
-
163
-
164
-
165
-
166
-
167
-
168
-
169
-
170
-
171
-
172
-
173
-
174
-
175
-
176
-
177
-
178
-
179
-
180
-
181
-
182
-
183
-
184
-
185
-
186
-
187
-
188
-
189
-
190
-
191
-
192
-
193
-
 194
194 -
 195
195 -
 196
196 -
 197
197 -
 198
198 -
 199
199 -
 200
200 -
 201
201 -
 202
202 -
 203
203 -
 204
204 -
 205
205 -
 206
206 -
 207
207 -
 208
208 -
 209
209 -
 210
210 -
 211
211 -
 212
212 -
 213
213 -
 214
214 -
215
-
216
-
217
-
218
-
219
-
220
-
221
-
222
-
223
-
224
-
225
-
226
-
227
-
228
-
229
-
230
-
231
-
232
-
233
-
234
-
235
-
236
-
237
-
238
-
239
-
240
-
241
-
242
-
243
-
244
-
245
-
246
-
247
-
248
-
249
-
250
-
251
-
252
-
253
-
254
-
255
-
256
-
257
-
258
-
259
-
260
-
261
-
262
-
263
-
264
-
265
-
266
-
267
-
268
-
269
-
270
-
271
-
272
-
273
-
274
-
275
-
276
-
277
-
278
-
279
-
280
-
281
-
282
-
283
-
284
-
285
-
286
-
287
-
288
-
289
-
290
-
291
-
292
-
293
-
294
-
295
-
296
-
297
-
298
-
299
-
300
 |
 |

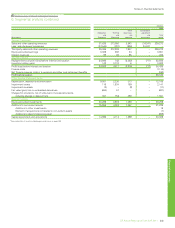
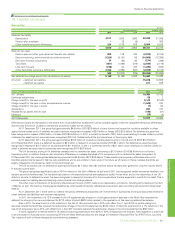
202 BP Annual Report and Form 20-F 2011
Notes on financial statements
6. Segmental analysis continued
$ million
2010
By business
Exploration
and
Production
Refining
and
Marketing
Other
businesses
and
corporate
Gulf of
Mexico
oil spill
response
Consolidation
adjustment
and
eliminations
Total
group
Segment revenues
Sales and other operating revenues 66,266 266,751 3,328 –(39,238) 297,107
Less: sales between businesses (37,049) (1,358) (831) –39,238 –
Third party sales and other operating revenues 29,217 265,393 2,497 – – 297,107
Equity-accounted earnings 3,979 755 23 – – 4,757
Interest revenues 83 46 109 – – 238
Segment results
Replacement cost profit (loss) before interest and taxation 30,886 5,555 (1,516) (40,858) 447 (5,486)
Inventory holding gainsa84 1,684 16 – – 1,784
Profit (loss) before interest and taxation 30,970 7,239 (1,500) (40,858) 447 (3,702)
Finance costs (1,170)
Net finance income relating to pensions and other post-retirement
benefits 47
Loss before taxation (4,825)
Other income statement items
Depreciation, depletion and amortization 8,616 2,258 290 – – 11,164
Impairment losses 1,259 144 113 – – 1,516
Impairment reversals –(141) (7) – – (148)
Fair value loss on embedded derivatives 309 – – – – 309
Charges for provisions, net of write-back of unused provisions,
including change in discount rate 303 275 206 30,266 –31,050
Segment assets
Equity-accounted investmentsb20,379 7,043 840 – – 28,262
Additions to non-current assets 20,113 4,030 1,226 – – 25,369
Additions to other investments 20
Element of acquisitions not related to non-current assets (401)
Additions to decommissioning asset (1,972)
Capital expenditure and acquisitions 17,753 4,029 1,234 – – 23,016
a See explanation of inventory holding gains and losses on page 200.
b Includes BP’s investment in Pan American Energy LLC following the termination of the sale agreement and the reinstatement of equity accounting. See Note 4 for further information.
http://www.bp.com/downloads/segmentalanalysis