BP 2011 Annual Report Download - page 233
Download and view the complete annual report
Please find page 233 of the 2011 BP annual report below. You can navigate through the pages in the report by either clicking on the pages listed below, or by using the keyword search tool below to find specific information within the annual report.-
 1
1 -
2
-
3
-
4
-
5
-
6
-
7
-
8
-
9
-
10
-
11
-
12
-
13
-
14
-
15
-
16
-
17
-
18
-
19
-
20
-
21
-
22
-
23
-
24
-
25
-
26
-
27
-
28
-
29
-
30
-
31
-
32
-
33
-
34
-
35
-
36
-
37
-
38
-
39
-
40
-
41
-
42
-
43
-
44
-
45
-
46
-
47
-
48
-
49
-
50
-
51
-
52
-
53
-
54
-
55
-
56
-
57
-
58
-
59
-
60
-
61
-
62
-
63
-
64
-
65
-
66
-
67
-
68
-
69
-
70
-
71
-
72
-
73
-
74
-
75
-
76
-
77
-
78
-
79
-
80
-
81
-
82
-
83
-
84
-
85
-
86
-
87
-
88
-
89
-
90
-
91
-
92
-
93
-
94
-
95
-
96
-
97
-
98
-
99
-
100
-
101
-
102
-
103
-
104
-
105
-
106
-
107
-
108
-
109
-
110
-
111
-
112
-
113
-
114
-
115
-
116
-
117
-
118
-
119
-
120
-
121
-
122
-
123
-
124
-
125
-
126
-
127
-
128
-
129
-
130
-
131
-
132
-
133
-
134
-
135
-
136
-
137
-
138
-
139
-
140
-
141
-
142
-
143
-
144
-
145
-
146
-
147
-
148
-
149
-
150
-
151
-
152
-
153
-
154
-
155
-
156
-
157
-
158
-
159
-
160
-
161
-
162
-
163
-
164
-
165
-
166
-
167
-
168
-
169
-
170
-
171
-
172
-
173
-
174
-
175
-
176
-
177
-
178
-
179
-
180
-
181
-
182
-
183
-
184
-
185
-
186
-
187
-
188
-
189
-
190
-
191
-
192
-
193
-
194
-
195
-
196
-
197
-
198
-
199
-
200
-
201
-
202
-
203
-
204
-
205
-
206
-
207
-
208
-
209
-
210
-
211
-
212
-
213
-
214
-
215
-
216
-
217
-
218
-
219
-
220
-
221
-
222
-
 223
223 -
 224
224 -
 225
225 -
 226
226 -
 227
227 -
 228
228 -
 229
229 -
 230
230 -
 231
231 -
 232
232 -
 233
233 -
 234
234 -
 235
235 -
 236
236 -
 237
237 -
 238
238 -
 239
239 -
 240
240 -
 241
241 -
 242
242 -
 243
243 -
244
-
245
-
246
-
247
-
248
-
249
-
250
-
251
-
252
-
253
-
254
-
255
-
256
-
257
-
258
-
259
-
260
-
261
-
262
-
263
-
264
-
265
-
266
-
267
-
268
-
269
-
270
-
271
-
272
-
273
-
274
-
275
-
276
-
277
-
278
-
279
-
280
-
281
-
282
-
283
-
284
-
285
-
286
-
287
-
288
-
289
-
290
-
291
-
292
-
293
-
294
-
295
-
296
-
297
-
298
-
299
-
300
 |
 |

Financial statements
BP Annual Report and Form 20-F 2011 231
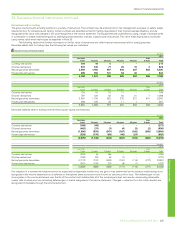
Notes on financial statements
36. Provisions
$ million
Decommissioning Environmental Spill response
Litigation and
claims
Clean Water
Act penalties Other Total
At 1 January 2011 10,544 2,465 1,043 11,967 3,510 2,378 31,907
Exchange adjustments (27) (4) –(13) –(12) (56)
Acquisitions 163 – – 9 – 118 290
New or increased provisions 4,596 1,677 586 3,821 –1,145 11,825
Write-back of unused provisions (1) (140) –(92) –(416) (649)
Unwinding of discount 195 27 –15 – 6 243
Change in discount rate 3,211 90 –45 –10 3,356
Utilization (342) (840) (1,293) (4,715) –(876) (8,066)
Reclassified as liabilities directly associated
with assets held for sale (51) –––––(51)
Deletions (1,048) (11) –(61) –(37) (1,157)
At 31 December 2011 17,240 3,264 336 10,976 3,510 2,316 37,642
Of which – current 596 1,375 282 8,518 –467 11,238
– non-current 16,644 1,889 54 2,458 3,510 1,849 26,404
$ million
Decommissioning Environmental Spill response
Litigation and
claims
Clean Water
Act penalties Other Total
At 1 January 2010 9,020 1,719 –1,076 –2,815 14,630
Exchange adjustments (114) – – (7) –(50) (171)
Acquisitions 188 – – 2 – 15 205
New or increased provisions 1,800 1,290 10,883 15,171 3,510 808 33,462
Write-back of unused provisions (12) (120) –(51) –(466) (649)
Unwinding of discount 168 29 –18 –19 234
Change in discount rate 444 22 – 9 – (6) 469
Utilization (164) (460) (9,840) (4,250) –(755) (15,469)
Reclassified as liabilities directly associated
with assets held for sale (381) (1) –––(1) (383)
Deletions (405) (14) –(1) –(1) (421)
At 31 December 2010 10,544 2,465 1,043 11,967 3,510 2,378 31,907
Of which – current 432 635 982 7,011 –429 9,489
– non-current 10,112 1,830 61 4,956 3,510 1,949 22,418
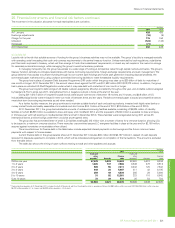
The group makes full provision for the future cost of decommissioning oil and natural gas wells, facilities and related pipelines on a discounted basis upon
installation. The provision for the costs of decommissioning these wells, production facilities and pipelines at the end of their economic lives has been
estimated using existing technology, at current prices or future assumptions, depending on the expected timing of the activity, and discounted using a real
discount rate of 0.5% (2010 1.5%). These costs are generally expected to be incurred over the next 30 years. While the provision is based on the best
estimate of future costs and the economic lives of the facilities and pipelines, there is uncertainty regarding both the amount and timing of these costs.
Provisions for environmental remediation are made when a clean-up is probable and the amount of the obligation can be estimated reliably.
Generally, this coincides with commitment to a formal plan of action or, if earlier, on divestment or on closure of inactive sites. The provision for
environmental liabilities has been estimated using existing technology, at current prices and discounted using a real discount rate of 0.5% (2010 1.5%).
The majority of these costs are expected to be incurred over the next 10 years. The extent and cost of future remediation programmes are inherently
difficult to estimate. They depend on the scale of any possible contamination, the timing and extent of corrective actions, and also the group’s share of
the liability.
The litigation category includes provisions for matters related to, for example, commercial disputes, product liability, and allegations of exposures
of third parties to toxic substances. Included within the other category at 31 December 2011 are provisions for deferred employee compensation of
$666 million (2010 $728 million). These provisions are discounted using either a nominal discount rate of 2.5% (2010 3.75%) or a real discount rate of
0.5% (2010 1.5%), as appropriate.
Provisions relating to the Gulf of Mexico oil spill
The Gulf of Mexico oil spill is described on pages 76 to 79 and in Note 2. Provisions relating to the Gulf of Mexico oil spill, included in the table above, are
separately presented below:
$ million
Environmental Spill response
Litigation and
claims
Clean Water
Act penalties Total
At 1 January 2011 809 1,043 10,973 3,510 16,335
New or increased provisions 1,167 586 3,430 –5,183
Unwinding of discount 6 – – – 6
Change in discount rate 17 – – – 17
Utilization (482) (1,293) (4,433) –(6,208)
At 31 December 2011 1,517 336 9,970 3,510 15,333
Of which – current 961 282 8,194 –9,437
– non-current 556 54 1,776 3,510 5,896
Of which – payable from the trust fund 1,066 –8,809 –9,875
http://www.bp.com/downloads/provisions