BP 2011 Annual Report Download - page 83
Download and view the complete annual report
Please find page 83 of the 2011 BP annual report below. You can navigate through the pages in the report by either clicking on the pages listed below, or by using the keyword search tool below to find specific information within the annual report.-
 1
1 -
2
-
3
-
4
-
5
-
6
-
7
-
8
-
9
-
10
-
11
-
12
-
13
-
14
-
15
-
16
-
17
-
18
-
19
-
20
-
21
-
22
-
23
-
24
-
25
-
26
-
27
-
28
-
29
-
30
-
31
-
32
-
33
-
34
-
35
-
36
-
37
-
38
-
39
-
40
-
41
-
42
-
43
-
44
-
45
-
46
-
47
-
48
-
49
-
50
-
51
-
52
-
53
-
54
-
55
-
56
-
57
-
58
-
59
-
60
-
61
-
62
-
63
-
64
-
65
-
66
-
67
-
68
-
69
-
70
-
71
-
72
-
 73
73 -
 74
74 -
 75
75 -
 76
76 -
 77
77 -
 78
78 -
 79
79 -
 80
80 -
 81
81 -
 82
82 -
 83
83 -
 84
84 -
 85
85 -
 86
86 -
 87
87 -
 88
88 -
 89
89 -
 90
90 -
 91
91 -
 92
92 -
 93
93 -
94
-
95
-
96
-
97
-
98
-
99
-
100
-
101
-
102
-
103
-
104
-
105
-
106
-
107
-
108
-
109
-
110
-
111
-
112
-
113
-
114
-
115
-
116
-
117
-
118
-
119
-
120
-
121
-
122
-
123
-
124
-
125
-
126
-
127
-
128
-
129
-
130
-
131
-
132
-
133
-
134
-
135
-
136
-
137
-
138
-
139
-
140
-
141
-
142
-
143
-
144
-
145
-
146
-
147
-
148
-
149
-
150
-
151
-
152
-
153
-
154
-
155
-
156
-
157
-
158
-
159
-
160
-
161
-
162
-
163
-
164
-
165
-
166
-
167
-
168
-
169
-
170
-
171
-
172
-
173
-
174
-
175
-
176
-
177
-
178
-
179
-
180
-
181
-
182
-
183
-
184
-
185
-
186
-
187
-
188
-
189
-
190
-
191
-
192
-
193
-
194
-
195
-
196
-
197
-
198
-
199
-
200
-
201
-
202
-
203
-
204
-
205
-
206
-
207
-
208
-
209
-
210
-
211
-
212
-
213
-
214
-
215
-
216
-
217
-
218
-
219
-
220
-
221
-
222
-
223
-
224
-
225
-
226
-
227
-
228
-
229
-
230
-
231
-
232
-
233
-
234
-
235
-
236
-
237
-
238
-
239
-
240
-
241
-
242
-
243
-
244
-
245
-
246
-
247
-
248
-
249
-
250
-
251
-
252
-
253
-
254
-
255
-
256
-
257
-
258
-
259
-
260
-
261
-
262
-
263
-
264
-
265
-
266
-
267
-
268
-
269
-
270
-
271
-
272
-
273
-
274
-
275
-
276
-
277
-
278
-
279
-
280
-
281
-
282
-
283
-
284
-
285
-
286
-
287
-
288
-
289
-
290
-
291
-
292
-
293
-
294
-
295
-
296
-
297
-
298
-
299
-
300
 |
 |

BP Annual Report and Form 20-F 2011 81
Business review: BP in more depth
Business review
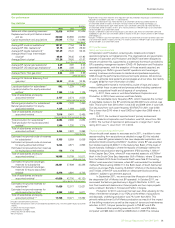
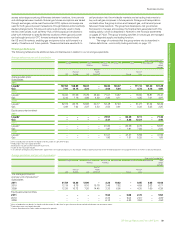
Our performance
Key statistics
$ million
2011 2010 2009
Sales and other operating revenuesa75,475 66,266 57,626
Replacement cost profit before interest
and tax 30,500 30,886 24,800
Capital expenditure and acquisitions 25,535 17,753 14,896
$ per barrel
Average BP crude oil realizationsb107.91 77.54 59.86
Average BP NGL realizationsb51.18 42.78 29.60
Average BP liquids realizationsb c 101.29 73.41 56.26
Average West Texas Intermediate
oil priced95.04 79.45 61.92
Average Brent oil priced111.26 79.50 61.67
$ per thousand cubic feet
Average BP natural gas realizationsb4.69 3.97 3.25
Average BP US natural gas realizationsb3.34 3.88 3.07
$ per million British thermal units
Average Henry Hub gas pricee4.04 4.39 3.99
pence per therm
Average UK National Balancing Point
gas priced56.33 42.45 30.85
thousand barrels per day
Liquids production for subsidiariesc f 992 1,229 1,400
Liquids production for equity-accounted
entitiesc f 1,165 1,145 1,135
Total of subsidiaries and equity-
accounted entitiesc f 2,157 2,374 2,535
million cubic feet per day
Natural gas production for subsidiariesf6,393 7,332 7,450
Natural gas production for equity-
accounted entitiesf1,125 1,069 1,035
Total of subsidiaries and equity-
accounted entitiesf7,518 8,401 8,485
thousand barrels of oil equivalent per day
Total production for subsidiariesf g 2,094 2,492 2,684
Total production for equity-accounted
entitiesf g 1,360 1,330 1,314
Total of subsidiaries and equity-
accounted entitiesf g 3,454 3,822 3,998
million barrels
Estimated net proved crude oil reserves
for subsidiariesc h 5,153 5,559 5,658
Estimated net proved crude oil reserves
for equity-accounted entitiesc i 5,234 4,971 4,853
Estimated net proved bitumen reserves
for equity-accounted entities 178 179 –
Total of subsidiaries and equity-
accounted entitiesc h i 10,565 10,709 10,511
billion cubic feet
Estimated net proved natural gas
reserves for subsidiariesj36,381 37,809 40,388
Estimated net proved natural gas
reserves for equity-accounted
entitiesk5,278 4,891 4,742
Total of subsidiaries and equity-
accounted entitiesj k 41,659 42,700 45,130
million barrels of oil equivalent
Estimated net proved reserves for
subsidiariesh j 11,426 12,077 12,621
Estimated net proved reserves for
equity-accounted entitiesi k 6,322 5,994 5,671
Total of subsidiaries and equity-
accounted entitiesh i j k 17,748 18,071 18,292
a Includes sales between businesses.
b Realizations are based on sales of consolidated subsidiaries only, which excludes equity-accounted
entities.
c Crude oil and natural gas liquids.
d All traded days average.
e Henry Hub First of Month Index.
f Net of royalties.
g Expressed in thousands of barrels of oil equivalent per day (mboe/d). Natural gas is converted to oil
equivalent at 5.8 billion cubic feet = 1 million barrels.
h Includes 20 million barrels (22 million barrels at 31 December 2010 and 23 million barrels at
31 December 2009) in respect of the 30% minority interest in BP Trinidad and Tobago LLC.
i Includes 310 million barrels (254 million barrels at 31 December 2010 and 243 million barrels at
31 December 2009) in respect of the 7.37% minority interest in TNK-BP (7.03% at 31 December
2010 and 6.86% at 31 December 2009).
j Includes 2,759 billion cubic feet of natural gas (2,921 billion cubic feet at 31 December 2010 and
3,068 billion cubic feet at 31 December 2009) in respect of the 30% minority interest in BP Trinidad
and Tobago LLC.
k Includes 174 billion cubic feet (137 billion cubic feet at 31 December 2010 and 131 billion cubic feet
at 31 December 2009) in respect of the 6.27% minority interest in TNK-BP (7.03% at 31 December
2010 and 6.86% at 31 December 2009).
2011 performance
Safety and operational risk
In Exploration and Production, ensuring safe, reliable and compliant
operations remains our highest priority. The organizational and governance
changes in Exploration and Production and S&OR have been designed to
ensure we achieve this, supported by a systematic framework provided by
BP’s operating management system (OMS). All Exploration and Production
operated businesses, with the exception of those recently acquired, are
now applying our OMS to govern their BP operations and have begun
working to achieve conformance to standards and practices required by
OMS through the performance improvement cycle process. We continue
to work to enhance local systems and processes at all our sites. See Safety
on pages 65-66 for more information on OMS.
Safety performance is monitored by a suite of input and output
metrics which focus on personal and process safety including operational
integrity, occupational health and all aspects of compliance.
In 2011, there were no workforce fatalities in Exploration and
Production. In 2010, there was one workforce fatality.
The recordable injury frequency (RIF), which measures the number
of recordable injuries to the BP workforce per 200,000 hours worked, was
0.30. This is lower than 2010 when it was 0.32 and 2009 when it was 0.39.
Our day away from work case frequency (DAFWCF) in 2011 was 0.060.
This is lower than 2010 when it was 0.063 but higher than 2009 when it
was 0.038.
In 2011, the number of reported loss of primary containment
(LOPC) incidents in Exploration and Production was 152, down from 194
in 2010. The number of reported oil spills equal to or larger than 1 barrel
during 2011 was 71, down from 117 in 2010.
Financial and operating performance
We continually seek access to resources and in 2011, in addition to new
access resulting from acquisitions as detailed on page 83, this included
Angola, where BP gained access to five new deepwater exploration and
production blocks covering 24,200km2; Australia, where BP was awarded
four blocks covering 24,500km2 in the Ceduna Sub Basin off the coast of
South Australia; Azerbaijan, where the republic of Azerbaijan ratified the
Shafag-Asiman production-sharing agreement (PSA) covering 1,100km2
in the Caspian Sea; China, where BP was awarded access to a 9,700km2
block in the South China Sea; deepwater Gulf of Mexico, where 12 leases
from the March 2010 Outer Continental Shelf Lease Sale 213 covering
280km2 were executed; Indonesia, where BP was awarded four coalbed
methane PSAs covering 4,800km2 in the Barito basin of South Kalimantan
and two oil and gas PSAs covering 16,400km2 offshore in the Arafura Sea;
and Trinidad, where BP was awarded two deepwater blocks covering
3,600km2, subject to government approval.
In September 2011, we announced the Moccasin oil discovery in
the deepwater Gulf of Mexico (not BP-operated). In October 2011, we
announced the Salmon gas discovery in Egypt’s Nile Delta. In 2011, we
took final investment decisions on three projects and two major projects
came onstream: Serrette in Trinidad and Pazflor in Angola.
Production for 2011 was lower than last year. After adjusting for the
effect of entitlement changes in our PSAs and the effect of acquisitions
and disposals, underlying production was 7% lower than 2010. This
primarily reflects lower Gulf of Mexico production as a result of the impact
of the drilling moratorium as well as the impact of turnaround maintenance
activities. In 2011, full-year production growth in TNK-BP was 2.8%.
Sales and other operating revenues for 2011 were $75 billion,
compared with $66 billion in 2010 and $58 billion in 2009. The increase