BP 2011 Annual Report Download - page 259
Download and view the complete annual report
Please find page 259 of the 2011 BP annual report below. You can navigate through the pages in the report by either clicking on the pages listed below, or by using the keyword search tool below to find specific information within the annual report.-
 1
1 -
2
-
3
-
4
-
5
-
6
-
7
-
8
-
9
-
10
-
11
-
12
-
13
-
14
-
15
-
16
-
17
-
18
-
19
-
20
-
21
-
22
-
23
-
24
-
25
-
26
-
27
-
28
-
29
-
30
-
31
-
32
-
33
-
34
-
35
-
36
-
37
-
38
-
39
-
40
-
41
-
42
-
43
-
44
-
45
-
46
-
47
-
48
-
49
-
50
-
51
-
52
-
53
-
54
-
55
-
56
-
57
-
58
-
59
-
60
-
61
-
62
-
63
-
64
-
65
-
66
-
67
-
68
-
69
-
70
-
71
-
72
-
73
-
74
-
75
-
76
-
77
-
78
-
79
-
80
-
81
-
82
-
83
-
84
-
85
-
86
-
87
-
88
-
89
-
90
-
91
-
92
-
93
-
94
-
95
-
96
-
97
-
98
-
99
-
100
-
101
-
102
-
103
-
104
-
105
-
106
-
107
-
108
-
109
-
110
-
111
-
112
-
113
-
114
-
115
-
116
-
117
-
118
-
119
-
120
-
121
-
122
-
123
-
124
-
125
-
126
-
127
-
128
-
129
-
130
-
131
-
132
-
133
-
134
-
135
-
136
-
137
-
138
-
139
-
140
-
141
-
142
-
143
-
144
-
145
-
146
-
147
-
148
-
149
-
150
-
151
-
152
-
153
-
154
-
155
-
156
-
157
-
158
-
159
-
160
-
161
-
162
-
163
-
164
-
165
-
166
-
167
-
168
-
169
-
170
-
171
-
172
-
173
-
174
-
175
-
176
-
177
-
178
-
179
-
180
-
181
-
182
-
183
-
184
-
185
-
186
-
187
-
188
-
189
-
190
-
191
-
192
-
193
-
194
-
195
-
196
-
197
-
198
-
199
-
200
-
201
-
202
-
203
-
204
-
205
-
206
-
207
-
208
-
209
-
210
-
211
-
212
-
213
-
214
-
215
-
216
-
217
-
218
-
219
-
220
-
221
-
222
-
223
-
224
-
225
-
226
-
227
-
228
-
229
-
230
-
231
-
232
-
233
-
234
-
235
-
236
-
237
-
238
-
239
-
240
-
241
-
242
-
243
-
244
-
245
-
246
-
247
-
248
-
 249
249 -
 250
250 -
 251
251 -
 252
252 -
 253
253 -
 254
254 -
 255
255 -
 256
256 -
 257
257 -
 258
258 -
 259
259 -
 260
260 -
 261
261 -
 262
262 -
 263
263 -
 264
264 -
 265
265 -
 266
266 -
 267
267 -
 268
268 -
 269
269 -
270
-
271
-
272
-
273
-
274
-
275
-
276
-
277
-
278
-
279
-
280
-
281
-
282
-
283
-
284
-
285
-
286
-
287
-
288
-
289
-
290
-
291
-
292
-
293
-
294
-
295
-
296
-
297
-
298
-
299
-
300
 |
 |

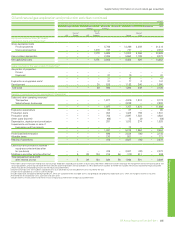
Financial statements
BP Annual Report and Form 20-F 2011 257
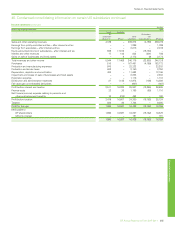
Notes on financial statements
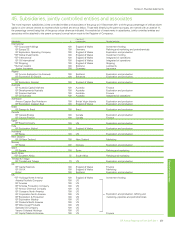
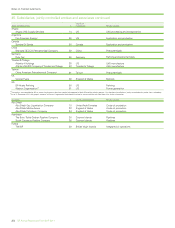
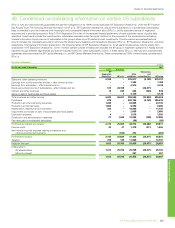
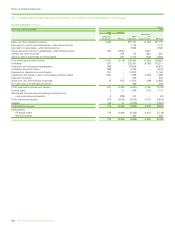
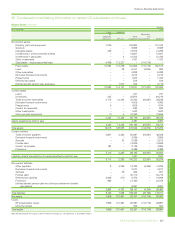
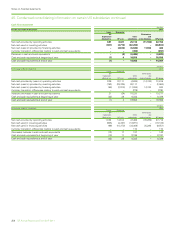
46. Condensed consolidating information on certain US subsidiaries continued
Balance Sheet continued
$ million
At 31 December 2010
Issuer Guarantor
BP
Exploration
(Alaska) Inc. BP p.l.c.
Other
subsidiariesa
Eliminations
and
reclassifications BP groupa
Non-current assets
Property, plant and equipment 7,679 –102,484 –110,163
Goodwill – – 8,598 –8,598
Intangible assets 425 –13,873 –14,298
Investments in jointly controlled entities – – 14,927 –14,927
Investments in associates – 2 13,333 –13,335
Other investments – – 1,191 –1,191
Subsidiaries – equity-accounted basis 4,489 112,227 –(116,716) –
Fixed assets 12,593 112,229 154,406 (116,716) 162,512
Loans –38 5,161 (4,305) 894
Other receivables – – 6,298 –6,298
Derivative financial instruments – – 4,210 –4,210
Prepayments – – 1,432 –1,432
Deferred tax assets – – 528 –528
Defined benefit pension plan surpluses –1,870 306 –2,176
12,593 114,137 172,341 (121,021) 178,050
Current assets
Loans – – 247 –247
Inventories 244 –25,974 –26,218
Trade and other receivables 3,173 14,444 42,783 (23,851) 36,549
Derivative financial instruments – – 4,356 –4,356
Prepayments 6 – 1,568 –1,574
Current tax receivable – – 693 –693
Other investments – – 1,532 –1,532
Cash and cash equivalents (1) 418,553 –18,556
3,422 14,448 95,706 (23,851) 89,725
Assets classified as held for sale – – 4,487 –4,487
3,422 14,448 100,193 (23,851) 94,212
Total assets 16,015 128,585 272,534 (144,872) 272,262
Current liabilities
Trade and other payables 4,931 2,362 62,887 (23,851) 46,329
Derivative financial instruments – – 3,856 –3,856
Accruals –23 5,589 –5,612
Finance debt – – 14,626 –14,626
Current tax payable 182 –2,738 –2,920
Provisions – – 9,489 –9,489
5,113 2,385 99,185 (23,851) 82,832
Liabilities directly associated with assets classified as held for sale – – 1,047 –1,047
5,113 2,385 100,232 (23,851) 83,879
Non-current liabilities
Other payables 94,258 14,323 (4,305) 14,285
Derivative financial instruments – – 3,677 –3,677
Accruals –35 602 –637
Finance debt – – 30,710 –30,710
Deferred tax liabilities 2,026 410 8,472 –10,908
Provisions 958 –21,460 –22,418
Defined benefit pension plan and other post-retirement benefit
plan deficits – – 9,857 –9,857
2,993 4,703 89,101 (4,305) 92,492
Total liabilities 8,106 7,088 189,333 (28,156) 176,371
Net assets 7,909 121,497 83,201 (116,716) 95,891
Equity
BP shareholders’ equity 7,909 121,497 82,297 (116,716) 94,987
Minority interest – – 904 –904
Total equity 7,909 121,497 83,201 (116,716) 95,891
a Adjusted following the termination of the Pan American Energy LLC sale agreement as described in Note 4.