BP 2011 Annual Report Download - page 199
Download and view the complete annual report
Please find page 199 of the 2011 BP annual report below. You can navigate through the pages in the report by either clicking on the pages listed below, or by using the keyword search tool below to find specific information within the annual report.-
 1
1 -
2
-
3
-
4
-
5
-
6
-
7
-
8
-
9
-
10
-
11
-
12
-
13
-
14
-
15
-
16
-
17
-
18
-
19
-
20
-
21
-
22
-
23
-
24
-
25
-
26
-
27
-
28
-
29
-
30
-
31
-
32
-
33
-
34
-
35
-
36
-
37
-
38
-
39
-
40
-
41
-
42
-
43
-
44
-
45
-
46
-
47
-
48
-
49
-
50
-
51
-
52
-
53
-
54
-
55
-
56
-
57
-
58
-
59
-
60
-
61
-
62
-
63
-
64
-
65
-
66
-
67
-
68
-
69
-
70
-
71
-
72
-
73
-
74
-
75
-
76
-
77
-
78
-
79
-
80
-
81
-
82
-
83
-
84
-
85
-
86
-
87
-
88
-
89
-
90
-
91
-
92
-
93
-
94
-
95
-
96
-
97
-
98
-
99
-
100
-
101
-
102
-
103
-
104
-
105
-
106
-
107
-
108
-
109
-
110
-
111
-
112
-
113
-
114
-
115
-
116
-
117
-
118
-
119
-
120
-
121
-
122
-
123
-
124
-
125
-
126
-
127
-
128
-
129
-
130
-
131
-
132
-
133
-
134
-
135
-
136
-
137
-
138
-
139
-
140
-
141
-
142
-
143
-
144
-
145
-
146
-
147
-
148
-
149
-
150
-
151
-
152
-
153
-
154
-
155
-
156
-
157
-
158
-
159
-
160
-
161
-
162
-
163
-
164
-
165
-
166
-
167
-
168
-
169
-
170
-
171
-
172
-
173
-
174
-
175
-
176
-
177
-
178
-
179
-
180
-
181
-
182
-
183
-
184
-
185
-
186
-
187
-
188
-
 189
189 -
 190
190 -
 191
191 -
 192
192 -
 193
193 -
 194
194 -
 195
195 -
 196
196 -
 197
197 -
 198
198 -
 199
199 -
 200
200 -
 201
201 -
 202
202 -
 203
203 -
 204
204 -
 205
205 -
 206
206 -
 207
207 -
 208
208 -
 209
209 -
210
-
211
-
212
-
213
-
214
-
215
-
216
-
217
-
218
-
219
-
220
-
221
-
222
-
223
-
224
-
225
-
226
-
227
-
228
-
229
-
230
-
231
-
232
-
233
-
234
-
235
-
236
-
237
-
238
-
239
-
240
-
241
-
242
-
243
-
244
-
245
-
246
-
247
-
248
-
249
-
250
-
251
-
252
-
253
-
254
-
255
-
256
-
257
-
258
-
259
-
260
-
261
-
262
-
263
-
264
-
265
-
266
-
267
-
268
-
269
-
270
-
271
-
272
-
273
-
274
-
275
-
276
-
277
-
278
-
279
-
280
-
281
-
282
-
283
-
284
-
285
-
286
-
287
-
288
-
289
-
290
-
291
-
292
-
293
-
294
-
295
-
296
-
297
-
298
-
299
-
300
 |
 |

Financial statements
BP Annual Report and Form 20-F 2011 197
Notes on financial statements
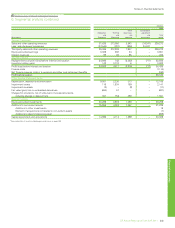
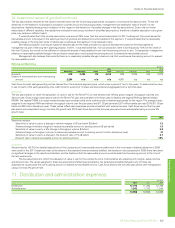
5. Disposals and impairment
$ million
2011 2010 2009
Proceeds from disposals of fixed assets 3,500 7,492 1,715
Proceeds from disposals of businesses, net of cash disposed (768) 9,462 966
2,732 16,954 2,681
By business
Exploration and Production 1,080 14,392 940
Refining and Marketing 721 1,840 1,294
Other businesses and corporate 931 722 447
2,732 16,954 2,681
Included in proceeds from disposal for 2010 are deposits of $6,197 million received from counterparties in respect of disposal transactions in the
Exploration and Production segment not completed at 31 December 2010, of which $30 million related to transactions still not completed at 31 December
2011. This included a deposit of $3,530 million received in advance of the expected sale of our interest in Pan American Energy LLC. 2011 proceeds from
disposal included the repayment of the same amount following the termination of the sale agreement as described in Note 4. No disposal deposits were
received in 2011 or 2009 for expected transactions which had not completed by the end of those years. For further information on disposal transactions
not yet completed see Note 4.
Deferred consideration relating to disposals of businesses and fixed assets at 31 December 2011 amounted to $117 million receivable within one
year (2010 $562 million and 2009 $807 million) and $111 million receivable after one year (2010 $271 million and 2009 $691 million).
$ million
2011 2010 2009
Gains on sale of businesses and fixed assets
Exploration and Production 3,477 5,267 1,717
Refining and Marketing 317 999 384
Other businesses and corporate 336 117 72
4,130 6,383 2,173
$ million
2011 2010 2009
Losses on sale of businesses and fixed assets
Exploration and Production 49 196 28
Refining and Marketing 52 119 154
Other businesses and corporate 3621
104 321 203
Impairment losses
Exploration and Production 1,443 1,259 118
Refining and Marketing 599 144 1,834
Other businesses and corporate 58 113 189
2,100 1,516 2,141
Impairment reversals
Exploration and Production (146) –(3)
Refining and Marketing –(141) –
Other businesses and corporate –(7) (8)
(146) (148) (11)
Impairment and losses on sale of businesses and fixed assets 2,058 1,689 2,333
Disposals
As part of the response to the consequences of the Gulf of Mexico oil spill, the group announced plans to deliver up to $30 billion of disposal proceeds by
the end of 2011. This target has now been increased to $38 billion of disposal proceeds by the end of 2013. Prior to this, in the normal course of business,
the group has sold interests in exploration and production properties, service stations and pipeline interests as well as non-core businesses. The group has
also disposed of other assets in the past, such as refineries, when this has met strategic objectives.
See Note 4 for further information relating to assets and associated liabilities held for sale at 31 December 2011.
Exploration and Production
In 2011, the major disposal transactions were the sale of our interests in Colombia to Ecopetrol and Talisman, the sale of our upstream and midstream
assets in Vietnam and our investments in equity-accounted entities in Venezuela to TNK-BP, and the sale of our assets in Pakistan to United Energy
Group. In addition, we also completed the disposal of half of the 3.29% interest in the Azeri-Chirag-Gunashli development in Azerbaijan to SOCAR and a
number of interests in the Gulf of Mexico to Marubeni Group. All of these transactions resulted in gains.
In 2010, the major transactions were the sale of Permian Basin assets in the US, upstream gas assets in Canada and exploration concessions in
Egypt to Apache Corporation. In addition, we sold 50% of our interests in Kirby oil sands in Canada to Devon Energy as part of a business combination
described in Note 3. All of these transactions resulted in gains.
In 2009, the major transactions were the sale of BP West Java Limited in Indonesia, the sale of our 49.9% interest in Kazakhstan Pipeline
Ventures LLC and the sale of our 46% stake in LukArco, all of which resulted in gains. We also exchanged interests in a number of fields in the North Sea
with BG Group plc.