BP 2011 Annual Report Download - page 209
Download and view the complete annual report
Please find page 209 of the 2011 BP annual report below. You can navigate through the pages in the report by either clicking on the pages listed below, or by using the keyword search tool below to find specific information within the annual report.-
 1
1 -
2
-
3
-
4
-
5
-
6
-
7
-
8
-
9
-
10
-
11
-
12
-
13
-
14
-
15
-
16
-
17
-
18
-
19
-
20
-
21
-
22
-
23
-
24
-
25
-
26
-
27
-
28
-
29
-
30
-
31
-
32
-
33
-
34
-
35
-
36
-
37
-
38
-
39
-
40
-
41
-
42
-
43
-
44
-
45
-
46
-
47
-
48
-
49
-
50
-
51
-
52
-
53
-
54
-
55
-
56
-
57
-
58
-
59
-
60
-
61
-
62
-
63
-
64
-
65
-
66
-
67
-
68
-
69
-
70
-
71
-
72
-
73
-
74
-
75
-
76
-
77
-
78
-
79
-
80
-
81
-
82
-
83
-
84
-
85
-
86
-
87
-
88
-
89
-
90
-
91
-
92
-
93
-
94
-
95
-
96
-
97
-
98
-
99
-
100
-
101
-
102
-
103
-
104
-
105
-
106
-
107
-
108
-
109
-
110
-
111
-
112
-
113
-
114
-
115
-
116
-
117
-
118
-
119
-
120
-
121
-
122
-
123
-
124
-
125
-
126
-
127
-
128
-
129
-
130
-
131
-
132
-
133
-
134
-
135
-
136
-
137
-
138
-
139
-
140
-
141
-
142
-
143
-
144
-
145
-
146
-
147
-
148
-
149
-
150
-
151
-
152
-
153
-
154
-
155
-
156
-
157
-
158
-
159
-
160
-
161
-
162
-
163
-
164
-
165
-
166
-
167
-
168
-
169
-
170
-
171
-
172
-
173
-
174
-
175
-
176
-
177
-
178
-
179
-
180
-
181
-
182
-
183
-
184
-
185
-
186
-
187
-
188
-
189
-
190
-
191
-
192
-
193
-
194
-
195
-
196
-
197
-
198
-
 199
199 -
 200
200 -
 201
201 -
 202
202 -
 203
203 -
 204
204 -
 205
205 -
 206
206 -
 207
207 -
 208
208 -
 209
209 -
 210
210 -
 211
211 -
 212
212 -
 213
213 -
 214
214 -
 215
215 -
 216
216 -
 217
217 -
 218
218 -
 219
219 -
220
-
221
-
222
-
223
-
224
-
225
-
226
-
227
-
228
-
229
-
230
-
231
-
232
-
233
-
234
-
235
-
236
-
237
-
238
-
239
-
240
-
241
-
242
-
243
-
244
-
245
-
246
-
247
-
248
-
249
-
250
-
251
-
252
-
253
-
254
-
255
-
256
-
257
-
258
-
259
-
260
-
261
-
262
-
263
-
264
-
265
-
266
-
267
-
268
-
269
-
270
-
271
-
272
-
273
-
274
-
275
-
276
-
277
-
278
-
279
-
280
-
281
-
282
-
283
-
284
-
285
-
286
-
287
-
288
-
289
-
290
-
291
-
292
-
293
-
294
-
295
-
296
-
297
-
298
-
299
-
300
 |
 |

Financial statements
BP Annual Report and Form 20-F 2011 207
Notes on financial statements
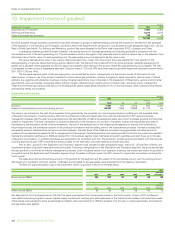
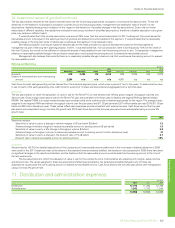
10. Impairment review of goodwill continued
The key assumptions required for the value-in-use estimation are the oil and natural gas prices, production volumes and the discount rate. To test the
sensitivity of the headroom to changes in production volumes and oil and natural gas prices, management has developed ‘rules of thumb’ for key
assumptions. Applying these gives an indication of the impact on the headroom of possible changes in the key assumptions. Due to the non-linear
relationship of different variables, the calculations were performed using a number of simplified assumptions, therefore a detailed calculation at any given
price may produce a different result.
It was estimated that if the oil price assumption was around 25% lower than the current assumption for 2017 and beyond, this would cause the
recoverable amount to be equal to the carrying amount of goodwill and related non-current assets of the segment. It was estimated that no reasonably
possible change in the long-term price of natural gas would cause the headroom to be reduced to zero.
Estimated production volumes are based on detailed data for the fields and take into account development plans for the fields agreed by
management as part of the long-term planning process. In 2011, it was estimated that, if all our production were to be reduced by 10% for the whole of
the next 15 years, this would not be sufficient to reduce the excess of recoverable amount over the carrying amount to zero. Consequently, management
believes no reasonably possible change in the production assumption would cause the carrying amount to exceed the recoverable amount.
Management also believes that currently there is no reasonably possible change in discount rate that would cause the carrying amount to exceed
the recoverable amount.
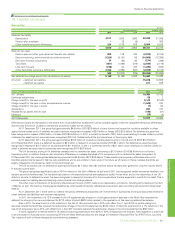
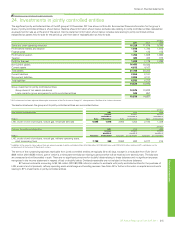
Refining and Marketing
$ million
2011 2010
Rhine FVC Lubricants Other Total Rhine FVC Lubricants Other Total
Goodwill 618 3,284 112 4,014 629 3,285 160 4,074
Excess of recoverable amount over carrying
amount 2,264 n/a n/a n/a 4,091 n/a n/a n/a
Cash flows for each cash-generating unit are derived from the business segment plans, which cover a period of two to five years. To determine the value
in use for each of the cash-generating units, cash flows for a period of 10 years are discounted and aggregated with a terminal value.
Rhine FVC
The key assumptions to which the calculation of value in use for the Rhine FVC is most sensitive are refinery gross margins, throughput volumes and
discount rate. Gross margin assumptions used in the Rhine FVC plan are consistent with those used to develop the regional Refining Marker Margin
(RMM). The regional RMM is a margin measure based upon product yields and a marker crude oil deemed appropriate for the region. The average values
assigned to the regional RMM and refinery throughput volume over the plan period are $11.35 per barrel and 257 million barrels per year (2010 $11.05 per
barrel and 248 million barrels per year). These values reflect past experience and are consistent with external sources. Cash flows beyond the five-year
plan period are extrapolated using a nominal 4% growth rate (2010 cash flows beyond the five-year plan period were extrapolated using a nominal 4%
growth rate).
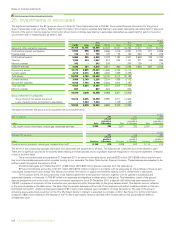
2011
Sensitivity analysis
Sensitivity of value in use to a change in refinery margins of $1 per barrel ($ billion) 1.5
Adverse change in refinery margins to reduce recoverable amount to carrying amount ($ per barrel) 1.5
Sensitivity of value in use to a 5% change in throughput volume ($ billion) 0.9
Adverse change in throughput volume to reduce recoverable amount to carrying amount (million barrels per year) 31
Sensitivity of value in use to a change in the discount rate of 1% ($ billion) 0.7
Discount rate to reduce recoverable amount to carrying amount 16%
Lubricants
As permitted by IAS 36, the detailed calculations of the Lubricants unit’s recoverable amount performed in the most recent detailed calculation in 2009
were used for the 2011 impairment test as the criteria in that standard were considered satisfied: the headroom was substantial in 2009; there have been
no significant changes in the assets and liabilities; and the likelihood that the recoverable amount would be less than the carrying amount at the time of
the test was remote.
The key assumptions to which the calculation of value in use for the Lubricants unit is most sensitive are operating unit margins, sales volumes
and discount rate. The values assigned to these key assumptions reflect past experience. No reasonably possible changes in any of these key
assumptions would cause the unit’s carrying amount to exceed its recoverable amount. Cash flows beyond the two-year plan period were extrapolated
using a nominal 3% growth rate.
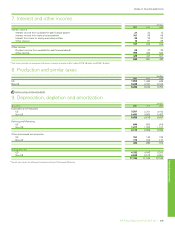
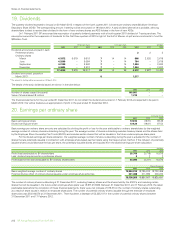
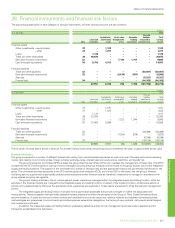
11. Distribution and administration expenses
$ million
2011 2010 2009
Distribution 12,416 11,393 12,798
Administration 1,542 1,162 1,240
13,958 12,555 14,038