BP 2011 Annual Report Download - page 232
Download and view the complete annual report
Please find page 232 of the 2011 BP annual report below. You can navigate through the pages in the report by either clicking on the pages listed below, or by using the keyword search tool below to find specific information within the annual report.-
 1
1 -
2
-
3
-
4
-
5
-
6
-
7
-
8
-
9
-
10
-
11
-
12
-
13
-
14
-
15
-
16
-
17
-
18
-
19
-
20
-
21
-
22
-
23
-
24
-
25
-
26
-
27
-
28
-
29
-
30
-
31
-
32
-
33
-
34
-
35
-
36
-
37
-
38
-
39
-
40
-
41
-
42
-
43
-
44
-
45
-
46
-
47
-
48
-
49
-
50
-
51
-
52
-
53
-
54
-
55
-
56
-
57
-
58
-
59
-
60
-
61
-
62
-
63
-
64
-
65
-
66
-
67
-
68
-
69
-
70
-
71
-
72
-
73
-
74
-
75
-
76
-
77
-
78
-
79
-
80
-
81
-
82
-
83
-
84
-
85
-
86
-
87
-
88
-
89
-
90
-
91
-
92
-
93
-
94
-
95
-
96
-
97
-
98
-
99
-
100
-
101
-
102
-
103
-
104
-
105
-
106
-
107
-
108
-
109
-
110
-
111
-
112
-
113
-
114
-
115
-
116
-
117
-
118
-
119
-
120
-
121
-
122
-
123
-
124
-
125
-
126
-
127
-
128
-
129
-
130
-
131
-
132
-
133
-
134
-
135
-
136
-
137
-
138
-
139
-
140
-
141
-
142
-
143
-
144
-
145
-
146
-
147
-
148
-
149
-
150
-
151
-
152
-
153
-
154
-
155
-
156
-
157
-
158
-
159
-
160
-
161
-
162
-
163
-
164
-
165
-
166
-
167
-
168
-
169
-
170
-
171
-
172
-
173
-
174
-
175
-
176
-
177
-
178
-
179
-
180
-
181
-
182
-
183
-
184
-
185
-
186
-
187
-
188
-
189
-
190
-
191
-
192
-
193
-
194
-
195
-
196
-
197
-
198
-
199
-
200
-
201
-
202
-
203
-
204
-
205
-
206
-
207
-
208
-
209
-
210
-
211
-
212
-
213
-
214
-
215
-
216
-
217
-
218
-
219
-
220
-
221
-
 222
222 -
 223
223 -
 224
224 -
 225
225 -
 226
226 -
 227
227 -
 228
228 -
 229
229 -
 230
230 -
 231
231 -
 232
232 -
 233
233 -
 234
234 -
 235
235 -
 236
236 -
 237
237 -
 238
238 -
 239
239 -
 240
240 -
 241
241 -
 242
242 -
243
-
244
-
245
-
246
-
247
-
248
-
249
-
250
-
251
-
252
-
253
-
254
-
255
-
256
-
257
-
258
-
259
-
260
-
261
-
262
-
263
-
264
-
265
-
266
-
267
-
268
-
269
-
270
-
271
-
272
-
273
-
274
-
275
-
276
-
277
-
278
-
279
-
280
-
281
-
282
-
283
-
284
-
285
-
286
-
287
-
288
-
289
-
290
-
291
-
292
-
293
-
294
-
295
-
296
-
297
-
298
-
299
-
300
 |
 |

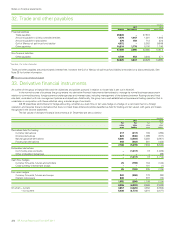
230 BP Annual Report and Form 20-F 2011
Notes on financial statements
34. Finance debt continued
Fair values
The estimated fair value of finance debt is shown in the table below together with the carrying amount as reflected in the balance sheet.
Long-term borrowings in the table below include the portion of debt that matures in the year from 31 December 2011, whereas in the balance
sheet the amount would be reported within current finance debt. The disposal deposits noted above are excluded from this analysis.
The carrying amount of the group’s short-term borrowings, comprising mainly commercial paper, approximates their fair value. The fair value of
the group’s long-term borrowings and finance lease obligations is estimated using quoted prices or, where these are not available, discounted cash flow
analyses based on the group’s current incremental borrowing rates for similar types and maturities of borrowing.
$ million
2011 2010
Fair value
Carrying
amount Fair value Carrying amount
Short-term borrowings 3,800 3,800 1,453 1,453
Long-term borrowings 40,606 39,691 37,258 36,876
Net obligations under finance leases 776 692 928 810
Total finance debt 45,182 44,183 39,639 39,139
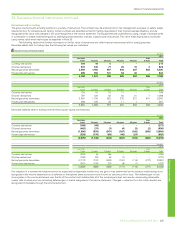
35. Capital disclosures and analysis of changes in net debt
The group defines capital as total equity. The group’s approach to managing capital is set out in its financial framework which BP continues to refine to
support the pursuit of value growth for shareholders, while maintaining a secure financial base. We intend to maintain a significant liquidity buffer and to
reduce our net debt ratio to the lower half of the 10-20% gearing range over time as our disposal programme progresses.
The group monitors capital on the basis of the net debt ratio, that is, the ratio of net debt to net debt plus equity. Net debt is calculated as gross
finance debt, as shown in the balance sheet, plus the fair value of associated derivative financial instruments that are used to hedge foreign exchange
and interest rate risks relating to finance debt, for which hedge accounting is applied, less cash and cash equivalents. Net debt and net debt ratio are
non-GAAP measures. BP believes these measures provide useful information to investors. Net debt enables investors to see the economic effect of
gross debt, related hedges and cash and cash equivalents in total. The net debt ratio enables investors to see how significant net debt is relative to equity
from shareholders. The derivatives are reported on the balance sheet within the headings ‘Derivative financial instruments’. All components of equity are
included in the denominator of the calculation. At 31 December 2011 the net debt ratio was 20.5% (2010 21.2%).
During 2011 and 2010, the company did not repurchase any of its own shares, other than to satisfy the requirements of certain employee
share-based payment plans.
http://www.bp.com/downloads/changesinnetdebt
$ million
At 31 December 2011 2010
Gross debt 44,213 45,336
Less: Cash and cash equivalents 14,067 18,556
Less: Fair value asset of hedges related to finance debt 1,133 916
Net debt 29,013 25,864
Equity 112,482 95,891
Net debt ratio 20.5% 21.2%
An analysis of changes in net debt is provided below.
$ million
2011 2010
Movement in net debt
Finance
debta
Cash and
cash
equivalents
Net
debt
Finance
debta
Cash and
cash
equivalents
Net
debt
At 1 January (44,420) 18,556 (25,864) (34,500) 8,339 (26,161)
Exchange adjustments 30 (492) (462) 194 (279) (85)
Net cash flow (4,725) (3,997) (8,722) (3,613) 10,496 6,883
Movement in finance debt relating to investing activitiesb6,167 –6,167 (6,197) –(6,197)
Other movements (132) –(132) (304) –(304)
At 31 December (43,080) 14,067 (29,013) (44,420) 18,556 (25,864)
a Including fair value of associated derivative financial instruments.
b See Note 34 for further information.