BP 2011 Annual Report Download - page 223
Download and view the complete annual report
Please find page 223 of the 2011 BP annual report below. You can navigate through the pages in the report by either clicking on the pages listed below, or by using the keyword search tool below to find specific information within the annual report.-
 1
1 -
2
-
3
-
4
-
5
-
6
-
7
-
8
-
9
-
10
-
11
-
12
-
13
-
14
-
15
-
16
-
17
-
18
-
19
-
20
-
21
-
22
-
23
-
24
-
25
-
26
-
27
-
28
-
29
-
30
-
31
-
32
-
33
-
34
-
35
-
36
-
37
-
38
-
39
-
40
-
41
-
42
-
43
-
44
-
45
-
46
-
47
-
48
-
49
-
50
-
51
-
52
-
53
-
54
-
55
-
56
-
57
-
58
-
59
-
60
-
61
-
62
-
63
-
64
-
65
-
66
-
67
-
68
-
69
-
70
-
71
-
72
-
73
-
74
-
75
-
76
-
77
-
78
-
79
-
80
-
81
-
82
-
83
-
84
-
85
-
86
-
87
-
88
-
89
-
90
-
91
-
92
-
93
-
94
-
95
-
96
-
97
-
98
-
99
-
100
-
101
-
102
-
103
-
104
-
105
-
106
-
107
-
108
-
109
-
110
-
111
-
112
-
113
-
114
-
115
-
116
-
117
-
118
-
119
-
120
-
121
-
122
-
123
-
124
-
125
-
126
-
127
-
128
-
129
-
130
-
131
-
132
-
133
-
134
-
135
-
136
-
137
-
138
-
139
-
140
-
141
-
142
-
143
-
144
-
145
-
146
-
147
-
148
-
149
-
150
-
151
-
152
-
153
-
154
-
155
-
156
-
157
-
158
-
159
-
160
-
161
-
162
-
163
-
164
-
165
-
166
-
167
-
168
-
169
-
170
-
171
-
172
-
173
-
174
-
175
-
176
-
177
-
178
-
179
-
180
-
181
-
182
-
183
-
184
-
185
-
186
-
187
-
188
-
189
-
190
-
191
-
192
-
193
-
194
-
195
-
196
-
197
-
198
-
199
-
200
-
201
-
202
-
203
-
204
-
205
-
206
-
207
-
208
-
209
-
210
-
211
-
212
-
 213
213 -
 214
214 -
 215
215 -
 216
216 -
 217
217 -
 218
218 -
 219
219 -
 220
220 -
 221
221 -
 222
222 -
 223
223 -
 224
224 -
 225
225 -
 226
226 -
 227
227 -
 228
228 -
 229
229 -
 230
230 -
 231
231 -
 232
232 -
 233
233 -
234
-
235
-
236
-
237
-
238
-
239
-
240
-
241
-
242
-
243
-
244
-
245
-
246
-
247
-
248
-
249
-
250
-
251
-
252
-
253
-
254
-
255
-
256
-
257
-
258
-
259
-
260
-
261
-
262
-
263
-
264
-
265
-
266
-
267
-
268
-
269
-
270
-
271
-
272
-
273
-
274
-
275
-
276
-
277
-
278
-
279
-
280
-
281
-
282
-
283
-
284
-
285
-
286
-
287
-
288
-
289
-
290
-
291
-
292
-
293
-
294
-
295
-
296
-
297
-
298
-
299
-
300
 |
 |

Financial statements
BP Annual Report and Form 20-F 2011 221
Notes on financial statements
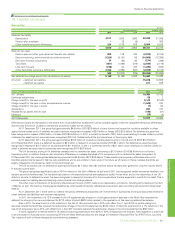
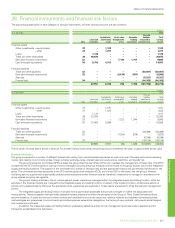
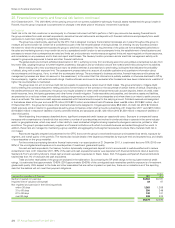
26. Financial instruments and financial risk factors continued
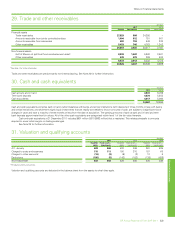
The movement in the valuation allowance for trade receivables is set out below.
$ million
2011 2010
At 1 January 428 430
Exchange adjustments (16) (9)
Charge for the year 115 150
Utilization (124) (143)
Write-back (71) –
At 31 December 332 428
(c) Liquidity risk
Liquidity risk is the risk that suitable sources of funding for the group’s business activities may not be available. The group’s liquidity is managed centrally
with operating units forecasting their cash and currency requirements to the central treasury function. Unless restricted by local regulations, subsidiaries
pool their cash surpluses to treasury, which will then arrange to fund other subsidiaries’ requirements, or invest any net surplus in the market or arrange
for necessary external borrowings, while managing the group’s overall net currency positions.
In managing its liquidity risk, the group has access to a wide range of funding at competitive rates through capital markets and banks. The group’s
treasury function centrally co-ordinates relationships with banks, borrowing requirements, foreign exchange requirements and cash management. The
group believes it has access to sufficient funding through its own current cash holdings and future cash generation including disposal proceeds, the
commercial paper markets and by using undrawn committed borrowing facilities to meet foreseeable liquidity requirements.
The group has in place a European Debt Issuance Programme (DIP) under which the group may raise up to $20 billion of debt for maturities of
one month or longer. At 31 December 2011, the amount drawn down against the DIP was $11,582 million (2010 $12,272 million). In addition, the group
has in place an unlimited US Shelf Registration under which it may raise debt with maturities of one month or longer.
The group has long-term debt ratings of A2 (stable outlook) assigned by Moody’s consistently throughout the year, and A (stable outlook) assigned
by Standard & Poor’s since July 2011, strengthened from A (negative outlook) in force at the start of the year.
During 2011 $10.7 billion of long-term taxable bonds were issued with tenors of between 18 months and 10 years, and $0.8 billion of US
Industrial/Municipal bonds were re-issued in term-out mode of between three and ten years. Flexible commercial paper is issued at competitive rates to
meet short-term borrowing requirements as and when needed.
As a further liquidity measure, the group continues to maintain suitable levels of cash and cash equivalents, invested with highly rated banks or
money market funds and readily accessible at immediate and short notice ($14.1 billion at the end of 2011; $18.6 billion at the end of 2010).
At 31 December 2011, the group had substantial amounts of undrawn borrowing facilities available, consisting of $6,925 million of standby
facilities (of which $6,825 million is available to draw and repay until mid-March 2014, and the equivalent of $100 million is available to draw and repay
in Chinese yuan with half expiring in mid-September 2012 and half in December 2012). These facilities were renegotiated during 2011 across 25
international banks, and borrowings under them would be at pre-agreed rates.
The group also has committed letter of credit (LC) facilities totalling $5,125 million with a number of banks for a one-year duration, allowing LCs
to be issued to a maximum one-year duration. There were also uncommitted secured LC evergreen facilities in place at the year end for $2,160 million,
secured against inventories or receivables when utilized.
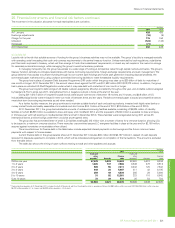
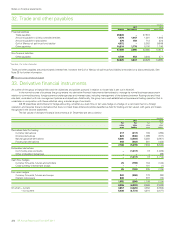
The amounts shown for finance debt in the table below include expected interest payments on borrowings and the future minimum lease
payments with respect to finance leases.
Current finance debt on the group balance sheet at 31 December 2011 includes $30 million (2010 $6,197 million) in respect of cash deposits
received for disposals expected to complete in 2012, which will be considered extinguished on completion of the transactions. This amount is excluded
from the table below.
The table also shows the timing of cash outflows relating to trade and other payables and accruals.
$ million
2011 2010
Trade and
other
payablesaAccruals
Finance
debt
Trade and
other
payablesaAccruals
Finance
debt
Within one year 47,678 5,933 10,024 42,691 5,612 9,353
1 to 2 years 1,605 137 7,866 6,549 278 6,816
2 to 3 years 569 55 7,311 6,242 125 7,542
3 to 4 years 449 26 5,487 411 42 6,105
4 to 5 years 259 49 4,634 365 28 5,494
5 to 10 years 31 82 12,381 323 110 6,642
Over 10 years 72 39 573 25 54 724
50,663 6,321 48,276 56,606 6,249 42,676
a Trade and other payables at 31 December 2011 includes the Gulf of Mexico oil spill trust fund liability which is payable as follows: $4,884 million within one year (2010 $5,008 million within one year,
$5,000 million payable in 1 to 2 years and $5,000 million payable in 2 to 3 years).