BP 2008 Annual Report Download - page 8
Download and view the complete annual report
Please find page 8 of the 2008 BP annual report below. You can navigate through the pages in the report by either clicking on the pages listed below, or by using the keyword search tool below to find specific information within the annual report.-
 1
1 -
 2
2 -
 3
3 -
 4
4 -
 5
5 -
 6
6 -
 7
7 -
 8
8 -
 9
9 -
 10
10 -
 11
11 -
 12
12 -
 13
13 -
 14
14 -
 15
15 -
 16
16 -
 17
17 -
 18
18 -
 19
19 -
20
-
21
-
22
-
23
-
24
-
25
-
26
-
27
-
28
-
29
-
30
-
31
-
32
-
33
-
34
-
35
-
36
-
37
-
38
-
39
-
40
-
41
-
42
-
43
-
44
-
45
-
46
-
47
-
48
-
49
-
50
-
51
-
52
-
53
-
54
-
55
-
56
-
57
-
58
-
59
-
60
-
61
-
62
-
63
-
64
-
65
-
66
-
67
-
68
-
69
-
70
-
71
-
72
-
73
-
74
-
75
-
76
-
77
-
78
-
79
-
80
-
81
-
82
-
83
-
84
-
85
-
86
-
87
-
88
-
89
-
90
-
91
-
92
-
93
-
94
-
95
-
96
-
97
-
98
-
99
-
100
-
101
-
102
-
103
-
104
-
105
-
106
-
107
-
108
-
109
-
110
-
111
-
112
-
113
-
114
-
115
-
116
-
117
-
118
-
119
-
120
-
121
-
122
-
123
-
124
-
125
-
126
-
127
-
128
-
129
-
130
-
131
-
132
-
133
-
134
-
135
-
136
-
137
-
138
-
139
-
140
-
141
-
142
-
143
-
144
-
145
-
146
-
147
-
148
-
149
-
150
-
151
-
152
-
153
-
154
-
155
-
156
-
157
-
158
-
159
-
160
-
161
-
162
-
163
-
164
-
165
-
166
-
167
-
168
-
169
-
170
-
171
-
172
-
173
-
174
-
175
-
176
-
177
-
178
-
179
-
180
-
181
-
182
-
183
-
184
-
185
-
186
-
187
-
188
-
189
-
190
-
191
-
192
-
193
-
194
-
195
-
196
-
197
-
198
-
199
-
200
-
201
-
202
-
203
-
204
-
205
-
206
-
207
-
208
-
209
-
210
-
211
 |
 |

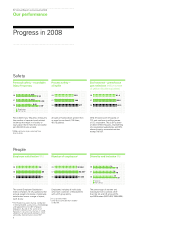
Here we present our key measures of progress
in the three priority areas of safety, people and
performance. While the measures we use to
chart nancial performance are well established,
we continue to evolve safety and people
measures to further enhance our reporting.
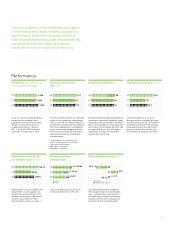
Performance
Production (thousand barrels
of oil equivalent per day)
08 3,838
07 3,818
06 3,926
Crude oil, natural gas liquids (NGLs)
and natural gas produced from
subsidiaries and equity-accounted
entities. Converted to barrels of
oil equivalent (boe) at 1 barrel of
NGL = 1boe and 5,800 standard
cubic feet of natural gas = 1boe.
Replacement cost prot
per ordinary share (cents)
08 136.20
07 95.85
06 110.95
Replacement cost prot reects the
replacement cost of supplies. It is
arrived at by excluding from prot
inventory holding gains and losses
and their associated tax effect.
(See footnotes a and b on page 1.)
Reserves replacement
ratioa b (%)
08 121c
07 112
06 113
Proved reserves replacement ratio (also
known as the production replacement
ratio) is the extent to which production
is replaced by proved reserves additions.
The ratio is expressed in oil equivalent
terms and includes changes resulting
from revisions to previous estimates,
improved recovery and extensions
and discoveries.
aCombined basis of subsidiaries and
equity-accounted entities, excluding
acquisitions and disposals.
bSee page 21, footnote f.
cSee page 11, footnote f.
Dividends paid per
ordinary share
55.05
08 29.387
42.30
07 20.995
38.40
06 21.104
Cents
Pence
The total dividend per share paid to
ordinary shareholders in the year.
Rening availability (%)
08 89
07 83
06 83
Rening availability represents Solomon
Associates’ operational availability, which
is dened as the percentage of the year
that a unit is available for processing after
subtracting the annualized time lost due
to turnaround activity and all planned
mechanical, process and regulatory
maintenance downtime.
Total shareholder return (%)
-34.5 08
08
-15.1
14.0
07
07 7.0
4.7
06
06
-4.6
ADS basis
Ordinary share basis
Total shareholder return represents
the change in value of a shareholding
over a calendar year, assuming that
dividends are re-invested to purchase
additional shares at the closing price
applicable on the ex-dividend date.
Operating cash ow ($ billion)
08 38.1
07 24.7
06 28.2
Operating cash ow is net cash
ow provided by operating activities,
from the group cash ow statement.
Operating activities are the principal
revenue-producing activities of the
group and other activities that are
not investing or nancing activities.
7