BP 2008 Annual Report Download - page 18
Download and view the complete annual report
Please find page 18 of the 2008 BP annual report below. You can navigate through the pages in the report by either clicking on the pages listed below, or by using the keyword search tool below to find specific information within the annual report.-
 1
1 -
2
-
3
-
4
-
5
-
6
-
7
-
 8
8 -
 9
9 -
 10
10 -
 11
11 -
 12
12 -
 13
13 -
 14
14 -
 15
15 -
 16
16 -
 17
17 -
 18
18 -
 19
19 -
 20
20 -
 21
21 -
 22
22 -
 23
23 -
 24
24 -
 25
25 -
 26
26 -
 27
27 -
 28
28 -
29
-
30
-
31
-
32
-
33
-
34
-
35
-
36
-
37
-
38
-
39
-
40
-
41
-
42
-
43
-
44
-
45
-
46
-
47
-
48
-
49
-
50
-
51
-
52
-
53
-
54
-
55
-
56
-
57
-
58
-
59
-
60
-
61
-
62
-
63
-
64
-
65
-
66
-
67
-
68
-
69
-
70
-
71
-
72
-
73
-
74
-
75
-
76
-
77
-
78
-
79
-
80
-
81
-
82
-
83
-
84
-
85
-
86
-
87
-
88
-
89
-
90
-
91
-
92
-
93
-
94
-
95
-
96
-
97
-
98
-
99
-
100
-
101
-
102
-
103
-
104
-
105
-
106
-
107
-
108
-
109
-
110
-
111
-
112
-
113
-
114
-
115
-
116
-
117
-
118
-
119
-
120
-
121
-
122
-
123
-
124
-
125
-
126
-
127
-
128
-
129
-
130
-
131
-
132
-
133
-
134
-
135
-
136
-
137
-
138
-
139
-
140
-
141
-
142
-
143
-
144
-
145
-
146
-
147
-
148
-
149
-
150
-
151
-
152
-
153
-
154
-
155
-
156
-
157
-
158
-
159
-
160
-
161
-
162
-
163
-
164
-
165
-
166
-
167
-
168
-
169
-
170
-
171
-
172
-
173
-
174
-
175
-
176
-
177
-
178
-
179
-
180
-
181
-
182
-
183
-
184
-
185
-
186
-
187
-
188
-
189
-
190
-
191
-
192
-
193
-
194
-
195
-
196
-
197
-
198
-
199
-
200
-
201
-
202
-
203
-
204
-
205
-
206
-
207
-
208
-
209
-
210
-
211
 |
 |

Performance review
BP Annual Report and Accounts 2008
Performance review
Exploration and Production
Our Exploration and Production segment includes upstream and
midstream activities in 29 countries, including Angola, Azerbaijan,
Canada, Egypt, Russia, Trinidad & Tobago (Trinidad), the UK, the US and
locations within Asia Pacific, Latin America, North Africa and the Middle
East, as well as gas marketing and trading activities, primarily in Canada,
Europe, the UK and the US. Upstream activities involve oil and natural
gas exploration and field development and production. Our exploration
programme is currently focused around Algeria, Angola, Azerbaijan,
Canada, Egypt, the deepwater Gulf of Mexico, Libya, the North Sea and
onshore US. Major development areas include Algeria, Angola, Asia
Pacific, Azerbaijan, Egypt and the deepwater Gulf of Mexico. During
2008, production came from 21 countries. The principal areas of
production are Angola, Asia Pacific, Azerbaijan, Egypt, Latin America,
the Middle East, Russia, Trinidad, the UK and the US.
Midstream activities involve the ownership and management
of crude oil and natural gas pipelines, processing facilities and export
terminals, LNG processing facilities and transportation, and our NGL
extraction businesses in the US and UK. Our most significant midstream
pipeline interests are the Trans-Alaska Pipeline System in the US, the
Forties Pipeline System and the Central Area Transmission System
pipeline, both in the UK sector of the North Sea, and the Baku-Tbilisi-
Ceyhan pipeline, running through Azerbaijan, Georgia and Turkey. Major
LNG activities are located in Trinidad, Indonesia and Australia. BP is also
investing in the LNG business in Angola.
Additionally, our activities include the marketing and trading of
natural gas, power and natural gas liquids in the US, Canada, UK and
Europe. These activities provide routes into liquid markets for BP's gas
and power, and generate margins and fees associated with the provision
of physical and financial products to third parties and additional income
from asset optimization and trading.
Our oil and natural gas production assets are located onshore and
offshore and include wells, gathering centres, in-field flow lines,
processing facilities, storage facilities, offshore platforms, export
systems (e.g. transit lines), pipelines and LNG plant facilities.
Upstream operations in Argentina, Bolivia, Abu Dhabi, Kazakhstan
and TNK-BP and some of the Sakhalin operations in Russia, as well as
some of our operations in Canada, Indonesia and Venezuela, are
conducted through equity-accounted entities.
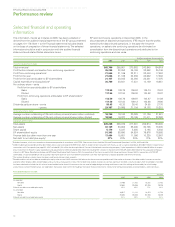
Our performance in 2008
Profit before interest and tax for 2008 was $37.9 billion, an increase of
37% compared with 2007. The increase was primarily driven by higher oil
and gas realizations. Our financial results are discussed in more detail on
pages 52-53.
In 2008, nine major projects came onstream. Production
commenced at the Thunder Horse field, with four wells in operation by
the end of the year, producing around 200,000boe/d (gross) making us
the largest producer in the Gulf of Mexico. We also started oil production
on our Deepwater Gunashli platform in the Azerbaijan sector of the
Caspian Sea. Other significant successes included the start of oil and gas
production at the Saqqara and Taurt fields in Egypt. Production from our
established centres including the North Sea, Alaska, North America Gas
and Trinidad & Tobago, was on plan. We are also increasing our ability to
get more from fields by improving our overall recovery rates through
developing and applying new technology.
In terms of the continued renewal of our oil and natural gas resource
base, 2008 was one of our best years this decade for new discoveries.
Total capital expenditure including acquisitions in 2008 was
$22.2 billion (2007 $14.2 billion and 2006 $13.3 billion). In 2008, there
were no significant acquisitions. Capital expenditure included $2.8 billion
relating to the formation of an integrated North American oil sands
business with Husky Energy Inc. It also included $3.7 billion relating to
the purchase of all Chesapeake Energy Corporation’s interest in the
Woodford Shale assets in the Arkoma basin, and the purchase of a 25%
interest in Chesapeake’s Fayetteville Shale assets, enabling further
growth of our North American gas business.
There were no significant acquisitions in 2006 and 2007. Capital
expenditure in 2006 included our investment of $1 billion in Rosneft.
Development expenditure incurred in 2008, excluding midstream
activities, was $11,767 million, compared with $10,153 million in 2007
and $9,109 million in 2006.
Looking ahead, our priorities remain the same: safety, people
and performance. We will continue to strive to deliver safe, reliable and
efficient operations while maintaining our flexibility so we can respond
to oil price volatility.
In 2009, oil and gas prices are expected to be significantly lower
than 2008. In response we will aim to use the operational momentum
generated in 2008 to continue to increase the efficiency of our cost
base and to build capability for the future. We intend to retain our rigour
around capital investment, in particular pacing our development to take
advantage of any cost reductions in a deflationary environment, and
supporting our strategy of growing the upstream business. We believe
that our portfolio of assets is strong and is well positioned to compete
and grow in a range of external conditions.
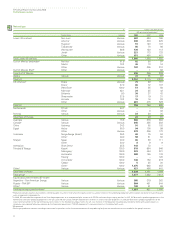
Comparative information presented in the table on the following
page has been restated, where appropriate, to reflect the
resegmentation, following transfers of certain businesses between
segments, that was effective from 1 January 2008. See page 16 for more
details.
Performance review
17