BP 2008 Annual Report Download - page 21
Download and view the complete annual report
Please find page 21 of the 2008 BP annual report below. You can navigate through the pages in the report by either clicking on the pages listed below, or by using the keyword search tool below to find specific information within the annual report.-
 1
1 -
2
-
3
-
4
-
5
-
6
-
7
-
8
-
9
-
10
-
 11
11 -
 12
12 -
 13
13 -
 14
14 -
 15
15 -
 16
16 -
 17
17 -
 18
18 -
 19
19 -
 20
20 -
 21
21 -
 22
22 -
 23
23 -
 24
24 -
 25
25 -
 26
26 -
 27
27 -
 28
28 -
 29
29 -
 30
30 -
 31
31 -
32
-
33
-
34
-
35
-
36
-
37
-
38
-
39
-
40
-
41
-
42
-
43
-
44
-
45
-
46
-
47
-
48
-
49
-
50
-
51
-
52
-
53
-
54
-
55
-
56
-
57
-
58
-
59
-
60
-
61
-
62
-
63
-
64
-
65
-
66
-
67
-
68
-
69
-
70
-
71
-
72
-
73
-
74
-
75
-
76
-
77
-
78
-
79
-
80
-
81
-
82
-
83
-
84
-
85
-
86
-
87
-
88
-
89
-
90
-
91
-
92
-
93
-
94
-
95
-
96
-
97
-
98
-
99
-
100
-
101
-
102
-
103
-
104
-
105
-
106
-
107
-
108
-
109
-
110
-
111
-
112
-
113
-
114
-
115
-
116
-
117
-
118
-
119
-
120
-
121
-
122
-
123
-
124
-
125
-
126
-
127
-
128
-
129
-
130
-
131
-
132
-
133
-
134
-
135
-
136
-
137
-
138
-
139
-
140
-
141
-
142
-
143
-
144
-
145
-
146
-
147
-
148
-
149
-
150
-
151
-
152
-
153
-
154
-
155
-
156
-
157
-
158
-
159
-
160
-
161
-
162
-
163
-
164
-
165
-
166
-
167
-
168
-
169
-
170
-
171
-
172
-
173
-
174
-
175
-
176
-
177
-
178
-
179
-
180
-
181
-
182
-
183
-
184
-
185
-
186
-
187
-
188
-
189
-
190
-
191
-
192
-
193
-
194
-
195
-
196
-
197
-
198
-
199
-
200
-
201
-
202
-
203
-
204
-
205
-
206
-
207
-
208
-
209
-
210
-
211
 |
 |

a
b
d
e
g
h
BP Annual Report and Accounts 2008
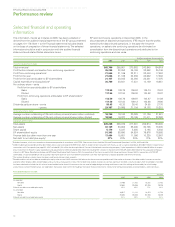
Performance review
%
2008 2007 2006
Proved reserves replacement ratio, excluding
equity-accounted entities
Proved reserves replacement ratio, excluding
equity-accounted entities, including
sales and purchases of reserves-in-place
Proved reserves replacement ratio, for equity-
accounted entities
Proved reserves replacement ratio, for equity-
accounted entities, including sales and
purchases of reserves-in-place
116 44 34
98 38 11
132 248 272
172 248 239
million barrels of oil equivalent
Additions to proved developed reserves,
excluding equity-accounted entities,
including sales and purchases of
reserves-in-placea
Additions to proved developed reserves, for
equity-accounted entities, including sales
and purchases of reserves-in-placea
826
751
929
473
675
936
%
Proved developed reserves replacement ratio,
excluding equity-accounted entities,
including sales and purchases of
reserves-in-place
Proved developed reserves replacement ratio,
for equity-accounted entities, including
sales and purchases of reserves-in-place
88
153
99
101
70
195
aThis includes some reserves that were previously classified as proved undeveloped.
In 2008, net additions to the group’s proved reserves (excluding sales and
purchases of reserves-in-place and equity-accounted entities) amounted
to 1,085mmboe, principally through improved recovery from, and
extensions to, existing fields and discoveries of new fields. Of the
reserves additions through improved recovery from, and extensions to,
existing fields and discoveries of new fields, approximately half are
associated with new projects and are proved undeveloped reserves
additions. The remainder are in existing developments where they
represent a mixture of proved developed and proved undeveloped
reserves. The principal reserves additions were in the US (Arkoma,
Thunder Horse, Wamsutter), Trinidad (Mango), Asia-Pacific (Tangguh),
Angola (Plutão, Saturno, Vênus and Marte, and Angola LNG) and
Azerbaijan (ACG).
Production
Our total hydrocarbon production during 2008 averaged 2,517 thousand
barrels of oil equivalent per day (mboe/d) for subsidiaries and
1,321mboe/d for equity-accounted entities, a decrease of 1.2% and an
increase of 4.0% respectively compared with 2007. For subsidiaries,
36% of our production was in the US and 12% in the UK. For equity-
accounted entities, 70% of production was from TNK-BP.
Total production is expected to be somewhat higher in 2009. The
actual growth rate will depend on a number of factors, including our pace
of capital spending, the efficiency of that spend (in turn depending on
industry cost deflation), the oil price and its impact on PSAs as well as
OPEC quota restrictions.
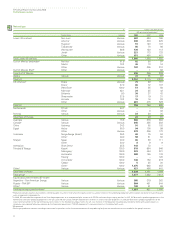
The following tables show BP’s estimated net proved reserves as
at 31 December 2008.
Estimated net proved reserves of liquids at 31 December 2008a b c
million barrels
Developed Undeveloped Total
UK
Rest of Europe
US
Rest of Americas
Asia Pacific
Africa
Russia
Other
410
81
1,717
58
77
464
–
174
119
194
1,273
56
69
496
–
477
529
275
2,990d
114e
146
960
–
651
Group 2,981 2,684 5,665
Equity-accounted entities 3,125 1,563 4,688f
Estimated net proved reserves of natural gas at 31 December 2008a b c
billion cubic feet
Developed Undeveloped Total
UK
Rest of Europe
US
Rest of Americas
Asia Pacific
Africa
Russia
Other
1,822
61
9,059
3,975
2,482
1,050
–
507
582
402
5,473
7,902
4,275
1,382
–
1,033
2,404
463
14,532
11,877g
6,757
2,432
–
1,540
Group 18,956 21,049 40,005
Equity-accounted entities 3,234 1,969 5,203h
Net proved reserves on an oil equivalent basis
mmboe
Developed Undeveloped Total
Group
Equity-accounted entities
6,249
3,683
6,313
1,902
12,562
5,585
Proved reserves exclude royalties due to others, whether payable in cash or in kind, where the
royalty owner has a direct interest in the underlying production and the option and ability to make
lifting and sales arrangements independently, and include minority interests in consolidated
operations. We disclose our share of reserves held in joint ventures and associates that are
accounted for by the equity method although we do not control these entities or the assets held by
such entities.
In certain deepwater fields, such as fields in the Gulf of Mexico, BP has claimed proved reserves
before production flow tests are conducted, in part because of the significant safety, cost and
environmental implications of conducting these tests. The industry has made substantial
technological improvements in understanding, measuring and delineating reservoir properties
without the need for flow tests. The general method of reserves assessment to determine
reasonable certainty of commercial recovery which BP employs relies on the integration of three
types of data: (1) well data used to assess the local characteristics and conditions of reservoirs and
fluids; (2) field scale seismic data to allow the interpolation and extrapolation of these characteristics
outside the immediate area of the local well control; and (3) data from relevant analogous fields.
Well data includes appraisal wells or sidetrack holes, full logging suites, core data and fluid samples.
BP considers the integration of this data in certain cases to be superior to a flow test in providing a
better understanding of the overall reservoir performance. The collection of data from logs, cores,
wireline formation testers, pressures and fluid samples calibrated to each other and to the seismic
data can allow reservoir properties to be determined over a greater volume than the localized
volume of investigation associated with a short-term flow test. Historically, proved reserves
recorded using these methods have been validated by actual production levels. As at the end of
2008, BP had proved reserves in 20 fields in the deepwater Gulf of Mexico that had been initially
booked prior to production flow testing. Of these fields, 18 are in production and two, Dorado and
Great White, are expected to begin production in 2009. Six other fields are in the early stages of
appraisal and development.
cThe 2008 year-end marker prices used were Brent $36.55/bbl (2007 $96.02/bbl and 2006
$58.93/bbl) and Henry Hub $5.63/mmBtu (2007 $7.10/mmBtu and 2006 $5.52/mmBtu).
Proved reserves in the Prudhoe Bay field in Alaska include an estimated 54 million barrels on which
a net profits royalty will be payable over the life of the field under the terms of the BP Prudhoe Bay
Royalty Trust.
Includes 21 million barrels of crude oil in respect of the 30% minority interest in BP Trinidad and
Tobago LLC.
fIncludes 216 million barrels of crude oil in respect of the 6.80% minority interest in TNK-BP.
Includes 3,108 billion cubic feet of natural gas in respect of the 30% minority interest in BP Trinidad
and Tobago LLC.
Includes 131 billion cubic feet of natural gas in respect of the 5.92% minority interest in TNK-BP.
20