BP 2008 Annual Report Download - page 144
Download and view the complete annual report
Please find page 144 of the 2008 BP annual report below. You can navigate through the pages in the report by either clicking on the pages listed below, or by using the keyword search tool below to find specific information within the annual report.-
 1
1 -
2
-
3
-
4
-
5
-
6
-
7
-
8
-
9
-
10
-
11
-
12
-
13
-
14
-
15
-
16
-
17
-
18
-
19
-
20
-
21
-
22
-
23
-
24
-
25
-
26
-
27
-
28
-
29
-
30
-
31
-
32
-
33
-
34
-
35
-
36
-
37
-
38
-
39
-
40
-
41
-
42
-
43
-
44
-
45
-
46
-
47
-
48
-
49
-
50
-
51
-
52
-
53
-
54
-
55
-
56
-
57
-
58
-
59
-
60
-
61
-
62
-
63
-
64
-
65
-
66
-
67
-
68
-
69
-
70
-
71
-
72
-
73
-
74
-
75
-
76
-
77
-
78
-
79
-
80
-
81
-
82
-
83
-
84
-
85
-
86
-
87
-
88
-
89
-
90
-
91
-
92
-
93
-
94
-
95
-
96
-
97
-
98
-
99
-
100
-
101
-
102
-
103
-
104
-
105
-
106
-
107
-
108
-
109
-
110
-
111
-
112
-
113
-
114
-
115
-
116
-
117
-
118
-
119
-
120
-
121
-
122
-
123
-
124
-
125
-
126
-
127
-
128
-
129
-
130
-
131
-
132
-
133
-
 134
134 -
 135
135 -
 136
136 -
 137
137 -
 138
138 -
 139
139 -
 140
140 -
 141
141 -
 142
142 -
 143
143 -
 144
144 -
 145
145 -
 146
146 -
 147
147 -
 148
148 -
 149
149 -
 150
150 -
 151
151 -
 152
152 -
 153
153 -
 154
154 -
155
-
156
-
157
-
158
-
159
-
160
-
161
-
162
-
163
-
164
-
165
-
166
-
167
-
168
-
169
-
170
-
171
-
172
-
173
-
174
-
175
-
176
-
177
-
178
-
179
-
180
-
181
-
182
-
183
-
184
-
185
-
186
-
187
-
188
-
189
-
190
-
191
-
192
-
193
-
194
-
195
-
196
-
197
-
198
-
199
-
200
-
201
-
202
-
203
-
204
-
205
-
206
-
207
-
208
-
209
-
210
-
211
 |
 |

5
2
1
Financial statements
BP Annual Report and Accounts 2008
Notes on financial statements
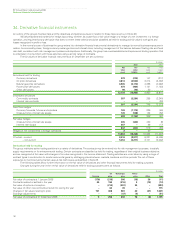
28. Financial instruments and financial risk factors continued
The group’s trading activities in the oil, natural gas and power markets are managed within the integrated supply and trading function, while activities
in the financial markets are managed by the treasury function. All derivative activity is carried out by specialist teams that have the appropriate skills,
experience and supervision. These teams are subject to close financial and management control.
The integrated supply and trading function maintains formal governance processes that provide oversight of market risk associated with trading
activity. These processes meet generally accepted industry practice and reflect the principles of the Group of Thirty Global Derivatives Study
recommendations. A policy and risk committee monitors and validates limits and risk exposures, reviews incidents and validates risk-related policies,
methodologies and procedures. A commitments committee approves value-at-risk delegations, the trading of new products, instruments and
strategies and material commitments.
In addition, the integrated supply and trading function undertakes derivative activity for risk management purposes under a separate control
framework as described more fully below.
(a) Market risk
Market risk is the risk or uncertainty arising from possible market price movements and their impact on the future performance of a business. The
market price movements that the group is exposed to include oil, natural gas and power prices (commodity price risk), foreign currency exchange
rates, interest rates, equity prices and other indices that could adversely affect the value of the group’s financial assets, liabilities or expected future
cash flows. The group enters into derivatives in a well established entrepreneurial trading operation. In addition, the group has developed a control
framework aimed at managing the volatility inherent in certain of its natural business exposures. In accordance with this control framework the group
enters into various transactions using derivatives for risk management purposes.
During recent periods of increased volatility in financial markets the group’s policies in relation to managing market risk continue to be
appropriate and are outlined in further detail below. The group measures market risk exposure arising from its trading positions using value-at-risk
techniques. These techniques are based on a variance/covariance model or a Monte Carlo simulation and make a statistical assessment of the market
risk arising from possible future changes in market prices over a 24-hour period. The calculation of the range of potential changes in fair value takes into
account a snapshot of the end-of-day exposures and the history of one-day price movements, together with the correlation of these price movements.
The value-at-risk measure is supplemented by stress testing and tail risk analysis.
The trading value-at-risk model is used for derivative financial instrument types such as: interest rate forward and futures contracts, swap
agreements, options and swaptions; foreign exchange forward and futures contracts, swap agreements and options; and oil, natural gas and power
price forwards, futures, swap agreements and options. Additionally, where physical commodities or non-derivative forward contracts are held as part
of a trading position, they are also reflected in the value-at-risk model. For options, a linear approximation is included in the value-at-risk models when
full revaluation is not possible.
The value-at-risk table does not incorporate any of the group’s natural business exposures or any derivatives entered into to risk manage those
exposures. Market risk exposure in respect of embedded derivatives is also not included in the value-at-risk table. Instead separate sensitivity analyses
are disclosed below.
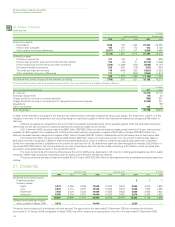
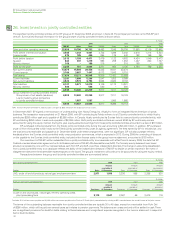
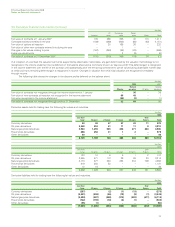
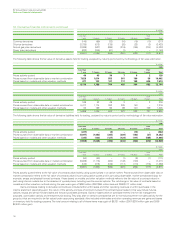
Value-at-risk limits are in place for each trading activity and for the group’s trading activity in total. The board has delegated an overall limit of
$100 million value at risk in support of this trading activity. The high and low values at risk indicated in the table below for each type of activity are
independent of each other. Through the portfolio effect the high value at risk for the group as a whole is lower than the sum of the highs for the
constituent parts. The potential movement in fair values is expressed to a 95% confidence interval. This means that, in statistical terms, one would
expect to see a decrease in fair values greater than the trading value at risk on one occasion per month if the portfolio were left unchanged.
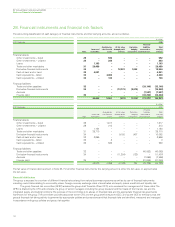
$ million
Value at risk for 1 day at 95% confidence interval 2008 2007
High Low Average Year end High Low Average Year end
Group trading 76 20 37 69 50 24 35 38
Oil price trading 69 12 25 63 46 16 26 34
Natural gas price trading 50 12 24 23 32 9 16 15
Power price trading 14 3 7 4 613
Currency trading 4– 2 – 613
Interest rate trading 7– 2 111 – 5 2
Other trading 51 2 2 7–2
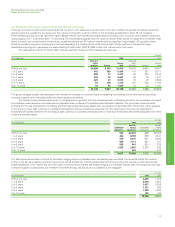
(i) Commodity price risk
The group’s integrated supply and trading function uses conventional financial and commodity instruments and physical cargoes available in the related
commodity markets. Natural gas swaps, options and futures are used to mitigate price risk. Power trading is undertaken using a combination of
over-the-counter forward contracts and other derivative contracts, including options and futures. This activity is on both a standalone basis and in
conjunction with gas derivatives in relation to gas-generated power margin. In addition, NGLs are traded around certain US inventory locations using
over-the-counter forward contracts in conjunction with over-the-counter swaps, options and physical inventories. Trading value-at-risk information in
relation to these activities is shown in the table above.
143