BP 2008 Annual Report Download - page 51
Download and view the complete annual report
Please find page 51 of the 2008 BP annual report below. You can navigate through the pages in the report by either clicking on the pages listed below, or by using the keyword search tool below to find specific information within the annual report.-
 1
1 -
2
-
3
-
4
-
5
-
6
-
7
-
8
-
9
-
10
-
11
-
12
-
13
-
14
-
15
-
16
-
17
-
18
-
19
-
20
-
21
-
22
-
23
-
24
-
25
-
26
-
27
-
28
-
29
-
30
-
31
-
32
-
33
-
34
-
35
-
36
-
37
-
38
-
39
-
40
-
 41
41 -
 42
42 -
 43
43 -
 44
44 -
 45
45 -
 46
46 -
 47
47 -
 48
48 -
 49
49 -
 50
50 -
 51
51 -
 52
52 -
 53
53 -
 54
54 -
 55
55 -
 56
56 -
 57
57 -
 58
58 -
 59
59 -
 60
60 -
 61
61 -
62
-
63
-
64
-
65
-
66
-
67
-
68
-
69
-
70
-
71
-
72
-
73
-
74
-
75
-
76
-
77
-
78
-
79
-
80
-
81
-
82
-
83
-
84
-
85
-
86
-
87
-
88
-
89
-
90
-
91
-
92
-
93
-
94
-
95
-
96
-
97
-
98
-
99
-
100
-
101
-
102
-
103
-
104
-
105
-
106
-
107
-
108
-
109
-
110
-
111
-
112
-
113
-
114
-
115
-
116
-
117
-
118
-
119
-
120
-
121
-
122
-
123
-
124
-
125
-
126
-
127
-
128
-
129
-
130
-
131
-
132
-
133
-
134
-
135
-
136
-
137
-
138
-
139
-
140
-
141
-
142
-
143
-
144
-
145
-
146
-
147
-
148
-
149
-
150
-
151
-
152
-
153
-
154
-
155
-
156
-
157
-
158
-
159
-
160
-
161
-
162
-
163
-
164
-
165
-
166
-
167
-
168
-
169
-
170
-
171
-
172
-
173
-
174
-
175
-
176
-
177
-
178
-
179
-
180
-
181
-
182
-
183
-
184
-
185
-
186
-
187
-
188
-
189
-
190
-
191
-
192
-
193
-
194
-
195
-
196
-
197
-
198
-
199
-
200
-
201
-
202
-
203
-
204
-
205
-
206
-
207
-
208
-
209
-
210
-
211
 |
 |

BP Annual Report and Accounts 2008
Performance review
Financial and operating performance
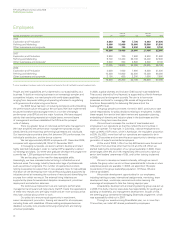
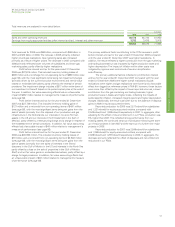
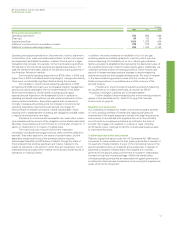
Group operating results
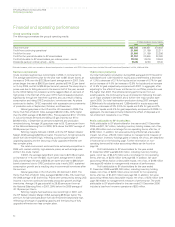
The following summarizes the group’s operating results.
$ million except per share amounts
2008 2007 2006
Total revenuesa 365,700 288,951 270,602
Profit from continuing operationsa 21,666 21,169 22,311
Profit for the year 21,666 21,169 22,286
Profit for the year attributable to BP shareholders 21,157 20,845 22,000
Profit attributable to BP shareholders per ordinary share – cents 112.59 108.76 109.84
Dividends paid per ordinary share – cents 55.05 42.30 38.40
aExcludes Innovene, which was treated as a discontinued operation in accordance with IFRS 5 ‘Non-current Assets Held for Sale and Discontinued Operations’ in 2004, 2005 and 2006.
Business environment
Crude oil prices reached new record highs in 2008, in nominal terms.
The average dated Brent price for the year rose to $97.26 per barrel, an
increase of 34% over the $72.39 per barrel average seen in 2007. Daily
prices began the year at $96.02 per barrel, peaked at $144.22 per barrel
on 3 July 2008, and fell to $36.55 per barrel at year-end. The sharp drop in
prices was due to falling demand in the second half of the year, caused
by the OECD falling into recession and the lagged effect on demand of
high prices in the first half of the year. OPEC had increased production
significantly through the first three quarters; and, as a result of falling
consumption and rising OPEC production, inventories rose. As prices
continued to decline, OPEC responded with successive announcements
of production cuts in September, October, and December.
Natural gas prices in the US and the UK increased in 2008. The
Henry Hub First of Month Index averaged $9.04/mmBtu, 32% higher
than the 2007 average of $6.86/mmBtu. Prices peaked at $13.11/mmBtu
in July amid robust demand and falling US gas imports, but fell to
$6.90/mmBtu in December as demand weakened and production
remained strong. Average UK gas prices rose to 58.12 pence per therm
at the National Balancing Point in 2008, 94% above the 2007 average of
29.95 pence per therm.
Refining margins fell back in 2008, with the BP Global Indicator
Margin (GIM) averaging $6.50 per barrel. The premium for light products
above fuel oils remained high, reflecting a continuing shortage of
upgrading capacity and the favouring of fully upgraded refineries over
less complex sites.
The retail environment continued to be extremely competitive in
2008 with market volatility, high absolute prices, as well as large price
shifts in the crude market.
In 2007, the average dated Brent price rose to $72.39 per barrel,
an increase of 11% over the $65.14 per barrel average seen in 2006.
Daily prices began the year at $58.62 per barrel and rose to $96.02 per
barrel at year-end due to OPEC production cuts in early 2007, sustained
consumption growth and a resulting drop in commercial inventories after
the summer.
Natural gas prices in the US and the UK declined in 2007. The
Henry Hub First of Month Index averaged $6.86/mmBtu, 5% lower than
the 2006 average of $7.24/mmBtu. Prices were pressured by strong LNG
imports in summer, continued domestic production growth and high
inventories. Average UK gas prices fell to 29.95 pence per therm at
the National Balancing Point in 2007, 29% below the 2006 average of
42.19 pence per therm.
Refining margins had reached a new record high in 2007, with
the BP Global Indicator Margin (GIM) averaging $9.94 per barrel. The
premium for light products above fuel oils remained exceptionally high,
reflecting a shortage of upgrading capacity and the favouring of fully
upgraded refineries over less complex sites.
Hydrocarbon production
Our total hydrocarbon production during 2008 averaged 2,517mboe/d for
subsidiaries and 1,321mboe/d for equity accounted-entities, a decrease
of 1.2% (a decrease of 3.1% for liquids and an increase of 0.7% for gas)
and an increase of 4.0% (an increase of 2.5% for liquids and an increase
of 14.8% for gas) respectively compared with 2007. In aggregate, after
adjusting for the effect of lower entitlement in our PSAs, production was
5% higher than 2007. This reflected strong performance from our
existing assets, the continued ramp-up of production following the start-
up of major projects in late-2007 and a further nine major project start-
ups in 2008. Our total hydrocarbon production during 2007 averaged
2,549mboe/d for subsidiaries and 1,269mboe/d for equity-accounted
entities, a decrease of 3% (3.5% for liquids and 2.6% for gas) and 2%
(1.3% for liquids and 8.4% for gas) respectively compared with 2006. In
aggregate, the decrease primarily reflected the effect of disposals and
net entitlement reductions in our PSAs.
Profit attributable to BP shareholders
Profit attributable to BP shareholders for the year ended 31 December
2008 was $21,157 million, including inventory holding losses, net of tax,
of $4,436 million and a net charge for non-operating items, after tax, of
$796 million. In addition, fair value accounting effects had a favourable
impact, net of tax, of $146 million relative to management’s measure of
performance. Inventory holdings gains or losses, net of tax, are described
in footnote (a) on the following page. Further information on non-
operating items and fair value accounting effects can be found on
page 55.
Profit attributable to BP shareholders for the year ended
31 December 2007 was $20,845 million, including inventory holding
gains, net of tax, of $2,475 million and a net charge for non-operating
items, after tax, of $373 million (see page 56). In addition, fair value
accounting effects had an unfavourable impact, net of tax, of $198 million
(see page 56) relative to management’s measure of performance.
Profit attributable to BP shareholders for the year ended
31 December 2006 was $22,000 million, including inventory holding
losses, net of tax, of $222 million and a net credit for non-operating
items, after tax, of $1,237 million (see page 56). In addition, fair value
accounting effects had a favourable impact, net of tax, of $72 million (see
page 56) relative to management’s measure of performance. The profit
attributable to BP shareholders for the year ended 31 December 2006
included a loss from Innovene operations of $25 million.
50