BP 2008 Annual Report Download - page 130
Download and view the complete annual report
Please find page 130 of the 2008 BP annual report below. You can navigate through the pages in the report by either clicking on the pages listed below, or by using the keyword search tool below to find specific information within the annual report.-
 1
1 -
2
-
3
-
4
-
5
-
6
-
7
-
8
-
9
-
10
-
11
-
12
-
13
-
14
-
15
-
16
-
17
-
18
-
19
-
20
-
21
-
22
-
23
-
24
-
25
-
26
-
27
-
28
-
29
-
30
-
31
-
32
-
33
-
34
-
35
-
36
-
37
-
38
-
39
-
40
-
41
-
42
-
43
-
44
-
45
-
46
-
47
-
48
-
49
-
50
-
51
-
52
-
53
-
54
-
55
-
56
-
57
-
58
-
59
-
60
-
61
-
62
-
63
-
64
-
65
-
66
-
67
-
68
-
69
-
70
-
71
-
72
-
73
-
74
-
75
-
76
-
77
-
78
-
79
-
80
-
81
-
82
-
83
-
84
-
85
-
86
-
87
-
88
-
89
-
90
-
91
-
92
-
93
-
94
-
95
-
96
-
97
-
98
-
99
-
100
-
101
-
102
-
103
-
104
-
105
-
106
-
107
-
108
-
109
-
110
-
111
-
112
-
113
-
114
-
115
-
116
-
117
-
118
-
119
-
 120
120 -
 121
121 -
 122
122 -
 123
123 -
 124
124 -
 125
125 -
 126
126 -
 127
127 -
 128
128 -
 129
129 -
 130
130 -
 131
131 -
 132
132 -
 133
133 -
 134
134 -
 135
135 -
 136
136 -
 137
137 -
 138
138 -
 139
139 -
 140
140 -
141
-
142
-
143
-
144
-
145
-
146
-
147
-
148
-
149
-
150
-
151
-
152
-
153
-
154
-
155
-
156
-
157
-
158
-
159
-
160
-
161
-
162
-
163
-
164
-
165
-
166
-
167
-
168
-
169
-
170
-
171
-
172
-
173
-
174
-
175
-
176
-
177
-
178
-
179
-
180
-
181
-
182
-
183
-
184
-
185
-
186
-
187
-
188
-
189
-
190
-
191
-
192
-
193
-
194
-
195
-
196
-
197
-
198
-
199
-
200
-
201
-
202
-
203
-
204
-
205
-
206
-
207
-
208
-
209
-
210
-
211
 |
 |

Financial statements
BP Annual Report and Accounts 2008
Notes on financial statements
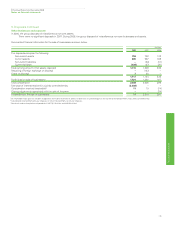
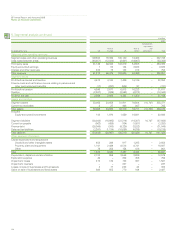
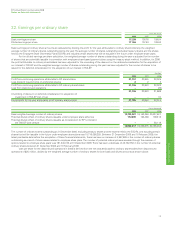
11. Impairment and losses on sale of businesses and fixed assets continued
Refining and Marketing
During 2008, the Refining and Marketing segment recognized impairment losses on a number of assets which in total amounted to $159 million.
The main component of the 2007 impairment charge of $1,186 million arose because of a decision to sell our company-owned and company-
operated sites in the US resulting in a $610 million write-down of the carrying amount of the sites to fair value less costs to sell. Following a decision
to sell certain assets at our Acetyls plant in Hull, UK, we wrote down the carrying amount of these assets to fair value less costs to sell leading to an
impairment charge of $186 million. Changing marketing conditions led to impairments in Samsung Petrochemical Company, to fair value less costs to
sell, and in China American Petrochemical Company amounting in total to $165 million. The balance relates principally to the write-downs of assets
elsewhere in the segment portfolio.
During 2006, certain assets in our Retail and Aromatics & Acetyls businesses were written down to fair value less costs to sell.
Other businesses and corporate
During 2008, Other businesses and corporate recognized impairment losses totalling $227 million primarily related to various assets in the Alternative
Energy business.
There were no significant impairments in 2007.
The impairment charge for 2006 relates to remaining chemical assets after the sale of Innovene.
Loss on sale of fixed assets
The principal transactions that give rise to the losses for each business segment are described below.
Exploration and Production
The group divested interests in a number of oil and natural gas properties in all three years. For 2006, the largest component of the loss is attributed
to the sale of properties in the Gulf of Mexico Shelf, which included increases in decommissioning liability estimates associated with the hurricane-
damaged fields that were divested during the year.
Refining and Marketing
For 2008, the principal transactions contributing to the loss were disposals of retail sites in the US and Europe.
For 2007, the principal transactions contributing to the loss were related to the decision to withdraw from the company-owned and company-
operated channel of trade in the US and retail churn. Retail churn is the overall process of acquiring and disposing of retail sites by which the group
aims to improve the quality and mix of its portfolio of service stations.
For 2006, the principal transactions contributing to the loss were retail churn.
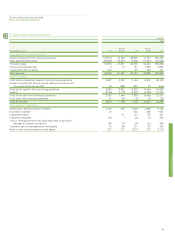
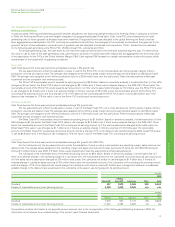
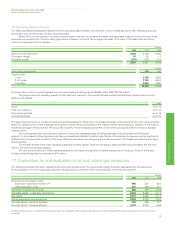
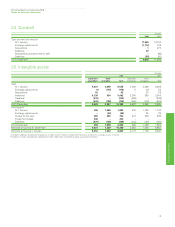
12. Impairment review of goodwill
$ million
Goodwill at 31 December 2008 2007
Exploration and Production 4,297 4,296
Refining and Marketing 5,462 6,626
Other businesses and corporate 119 84
9,878 11,006
Goodwill acquired through business combinations has been allocated to groups of cash-generating units (cash-generating units) that are expected to
benefit from the synergies of the acquisition. For Exploration and Production, goodwill has been allocated to each geographic region, that is UK, Rest
of Europe, US and Rest of World, and for Refining and Marketing, goodwill has been allocated to the Rhine Fuels Value Chain (FVC), US West Coast
FVC, Lubricants and Other.
In assessing whether goodwill has been impaired, the carrying amount of the cash-generating unit (including goodwill) is compared with the
recoverable amount of the cash-generating unit. The recoverable amount is the higher of fair value less costs to sell and value in use. In the absence
of any information about the fair value of a cash-generating unit, the recoverable amount is deemed to be the value in use.
The group calculates the recoverable amount as the value in use using a discounted cash flow model. The future cash flows are adjusted
for risks specific to the cash-generating unit and are discounted using a pre-tax discount rate. The discount rate is derived from the group’s post-tax
weighted average cost of capital and is adjusted where applicable to take into account any specific risks relating to the country where the
cash-generating unit is located. Typically rates of 11% or 13% are used (2007 11% or 13%). The rate to be applied to each country is reassessed
each year. A discount rate of 11% has been used for all goodwill impairment calculations performed in 2008 (2007 11%).
The three-year or four-year business segment plans, which are approved on an annual basis by senior management, are the primary source
of information for the determination of value in use. They contain forecasts for oil and natural gas production, refinery throughputs, sales volumes for
various types of refined products (e.g. gasoline and lubricants), revenues, costs and capital expenditure. As an initial step in the preparation of these
plans, various environmental assumptions, such as oil prices, natural gas prices, refining margins, refined product margins and cost inflation rates, are
set by senior management. These environmental assumptions take account of existing prices, global supply-demand equilibrium for oil and natural gas,
other macroeconomic factors and historical trends and variability.
For the purposes of impairment testing, the group’s Brent oil price assumption is an average $49 per barrel in 2009, $59 per barrel in 2010,
$65 per barrel in 2011, $68 per barrel in 2012, $70 per barrel in 2013 and $75 per barrel in 2014 and beyond (2007 average $90 per barrel in 2008,
$86 per barrel in 2009, $84 per barrel in 2010, $84 per barrel in 2011, $84 per barrel in 2012 and $60 per barrel in 2013 and beyond). Similarly, the
129